This is an old revision of the document!
Table of Contents
Correlation and Regression: What's My Line?
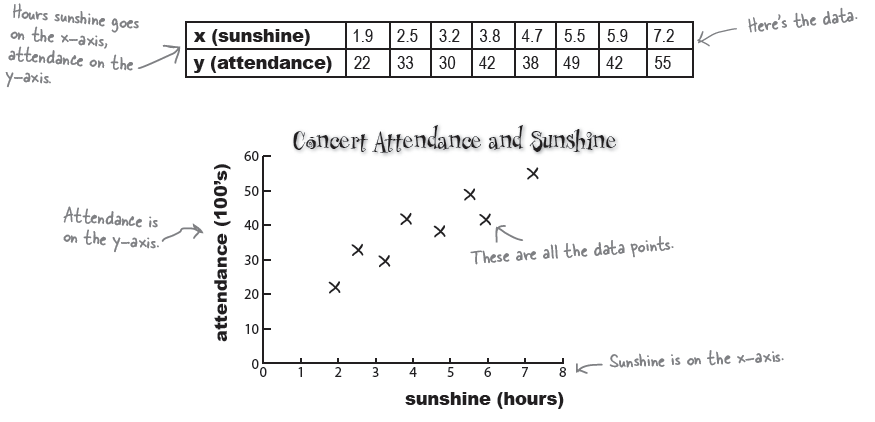
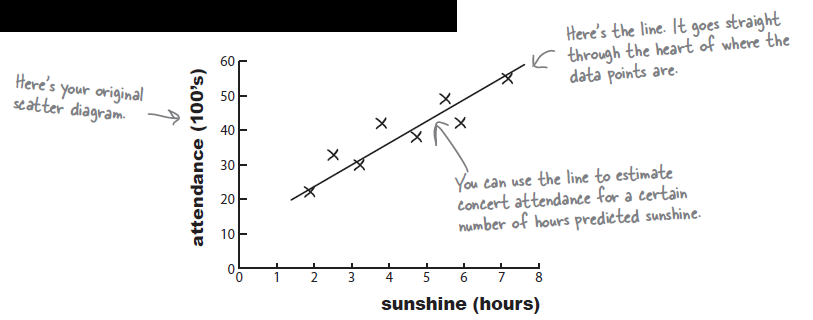
> s <- c(1.9,2.5,3.2,3.8,4.7,5.5, 5.9, 7.2)
> c <- c(22,33,30,42,38,49,42,55)
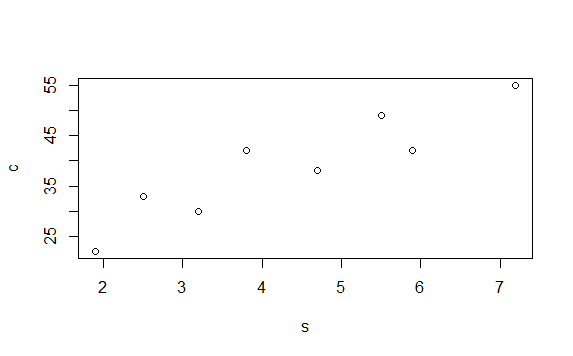
> plot(s,c)
> df <- data.frame(s,c)
> df
    s  c
1 1.9 22
2 2.5 33
3 3.2 30
4 3.8 42
5 4.7 38
6 5.5 49
7 5.9 42
8 7.2 55
> plot(df)
Predict values with a line of best fit
\begin{eqnarray*} b & = & \frac{\Sigma{(x-\overline(x))(y-\overline(y))}}{\Sigma{(x-\overline{x})^2}} \\ & = & \frac{\text{SP}}{\text{SS}_{x}} \\ a & = & \overline{y} - b \overline{x} \end{eqnarray*}
> mod <- lm(c~s, data=df)
> summary(mod)

Call:
lm(formula = c ~ s, data = df)

Residuals:
    Min      1Q  Median      3Q     Max
-5.2131 -3.0740 -0.9777  3.9237  5.9933

Coefficients:
            Estimate Std. Error t value Pr(>|t|)
(Intercept)  15.7283     4.4372   3.545  0.01215 *
s             5.3364     0.9527   5.601  0.00138 **
---
Signif. codes:  0 ‘***’ 0.001 ‘**’ 0.01 ‘*’ 0.05 ‘.’ 0.1 ‘ ’ 1

Residual standard error: 4.571 on 6 degrees of freedom
Multiple R-squared:  0.8395,	Adjusted R-squared:  0.8127
F-statistic: 31.37 on 1 and 6 DF,  p-value: 0.001379
Correlation
Textbook says:
$$ r = b * \frac {sd(x)}{sd(y)} $$
Regression page says:
\begin{eqnarray}
R^2 & = & \frac{\text{SS}_{reg}}{\text{SS}_{total}} \\
& = & \frac{ \text{SS}_{total} - \text{SS}_{res}} {\text{SS}_{total}} \nonumber \\
& = & 1 - \frac{\text{SS}_{res}} {\text{SS}_{total}} \\
& & \text{Note that (1), (2) are the same.} \nonumber \\
& & \text{Therefore,} \nonumber \\
r & = & \sqrt{R^2}
\end{eqnarray}
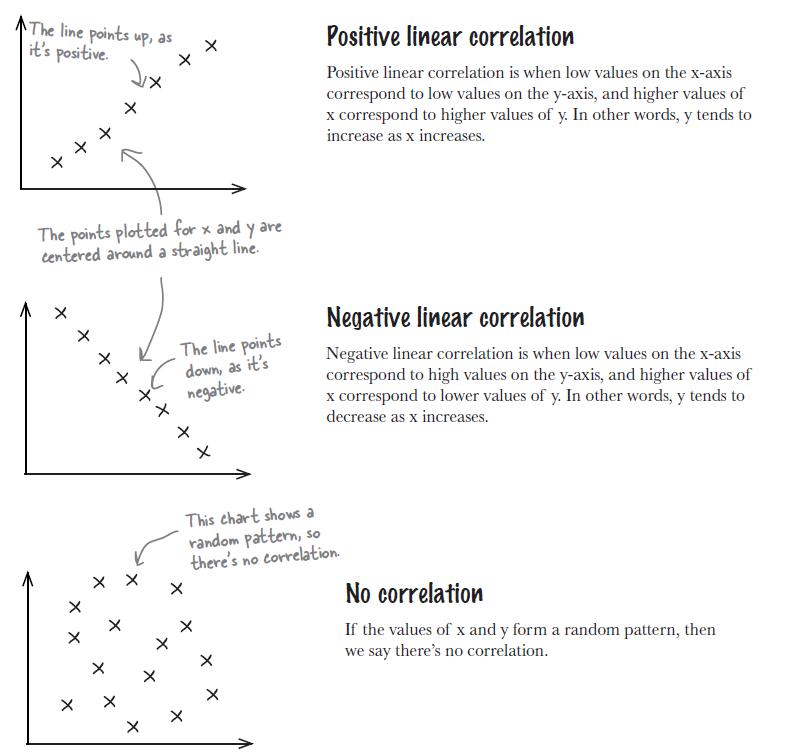
We also addressed that r (correlation coefficient value) can be obtained through
\begin{eqnarray*}
r & = & \frac {Cov(x,y)} {sd(x)*sd(y)} \\
& & \text{Note that } \\
Cov(x,y) & = & \frac {SP} {n-1}
\end{eqnarray*}
# check the coefficient from the lm analysis
> summary(mod)$coefficients
             Estimate Std. Error  t value    Pr(>|t|)
(Intercept) 15.728319  4.4372270 3.544628 0.012150696
s            5.336411  0.9527289 5.601184 0.001379363

> b <- 5.336411
> df
    s  c
1 1.9 22
2 2.5 33
3 3.2 30
4 3.8 42
5 4.7 38
6 5.5 49
7 5.9 42
8 7.2 55
> sd(df$s)
[1] 1.813393
> sd(df$c)
[1] 10.56189
>
> r.value <- b * (sd(df$s)/sd(df$c))
> r.value
[1] 0.916219
>

# rsquared
> sqrt(summary(mod)$r.squared)
[1] 0.9162191

# or
> cov.sc <- cov(df$s, df$c)
> sd.x <- sd(df$s)
> sd.y <- sd(df$c)
> r.value2 <- cov.sc/(sd.x*sd.y)
>
> r.value2
[1] 0.9162191
>


