Table of Contents
Notes on Graphics Functions
It is important to understand the distinction between high-level and low-level graphics functions. A high-level graphics function starts a new graph. It initializes the graphics window (creating it if necessary); sets the scale; maybe draws some adornments, such as a title and labels; and renders the graphic. Examples include:
plot
- Generic plotting function
boxplot
- Create a box plot
hist
- Create a histogram
qqnorm
- Create a quantile-quantile (Q-Q) plot
curve
- Graph a function
A low-level graphics function cannot start a new graph. Rather, it adds something to an existing graph: points, lines, text, adornments, and so forth. Examples include:
points
- Add points
lines
- Add lines
abline
- Add a straight line
segments
- Add line segments
polygon
- Add a closed polygon
text
- Add text
You must call a high-level graphics routine before calling a low-level graphics routine. The low-level routine needs to have the graph initialized; otherwise, you get an error like this:
> abline(a=0, b=1)
Error in int_abline(a = a, b = b, h = h, v = v, untf = untf, ...) :
  plot.new has not been called yet
plot(x) produces different results depending on whether x is a vector, a factor, a data frame, a linear regression model, a table, or whatever.
Creating a Scatter Plot
Scatter Plot (number by number data)
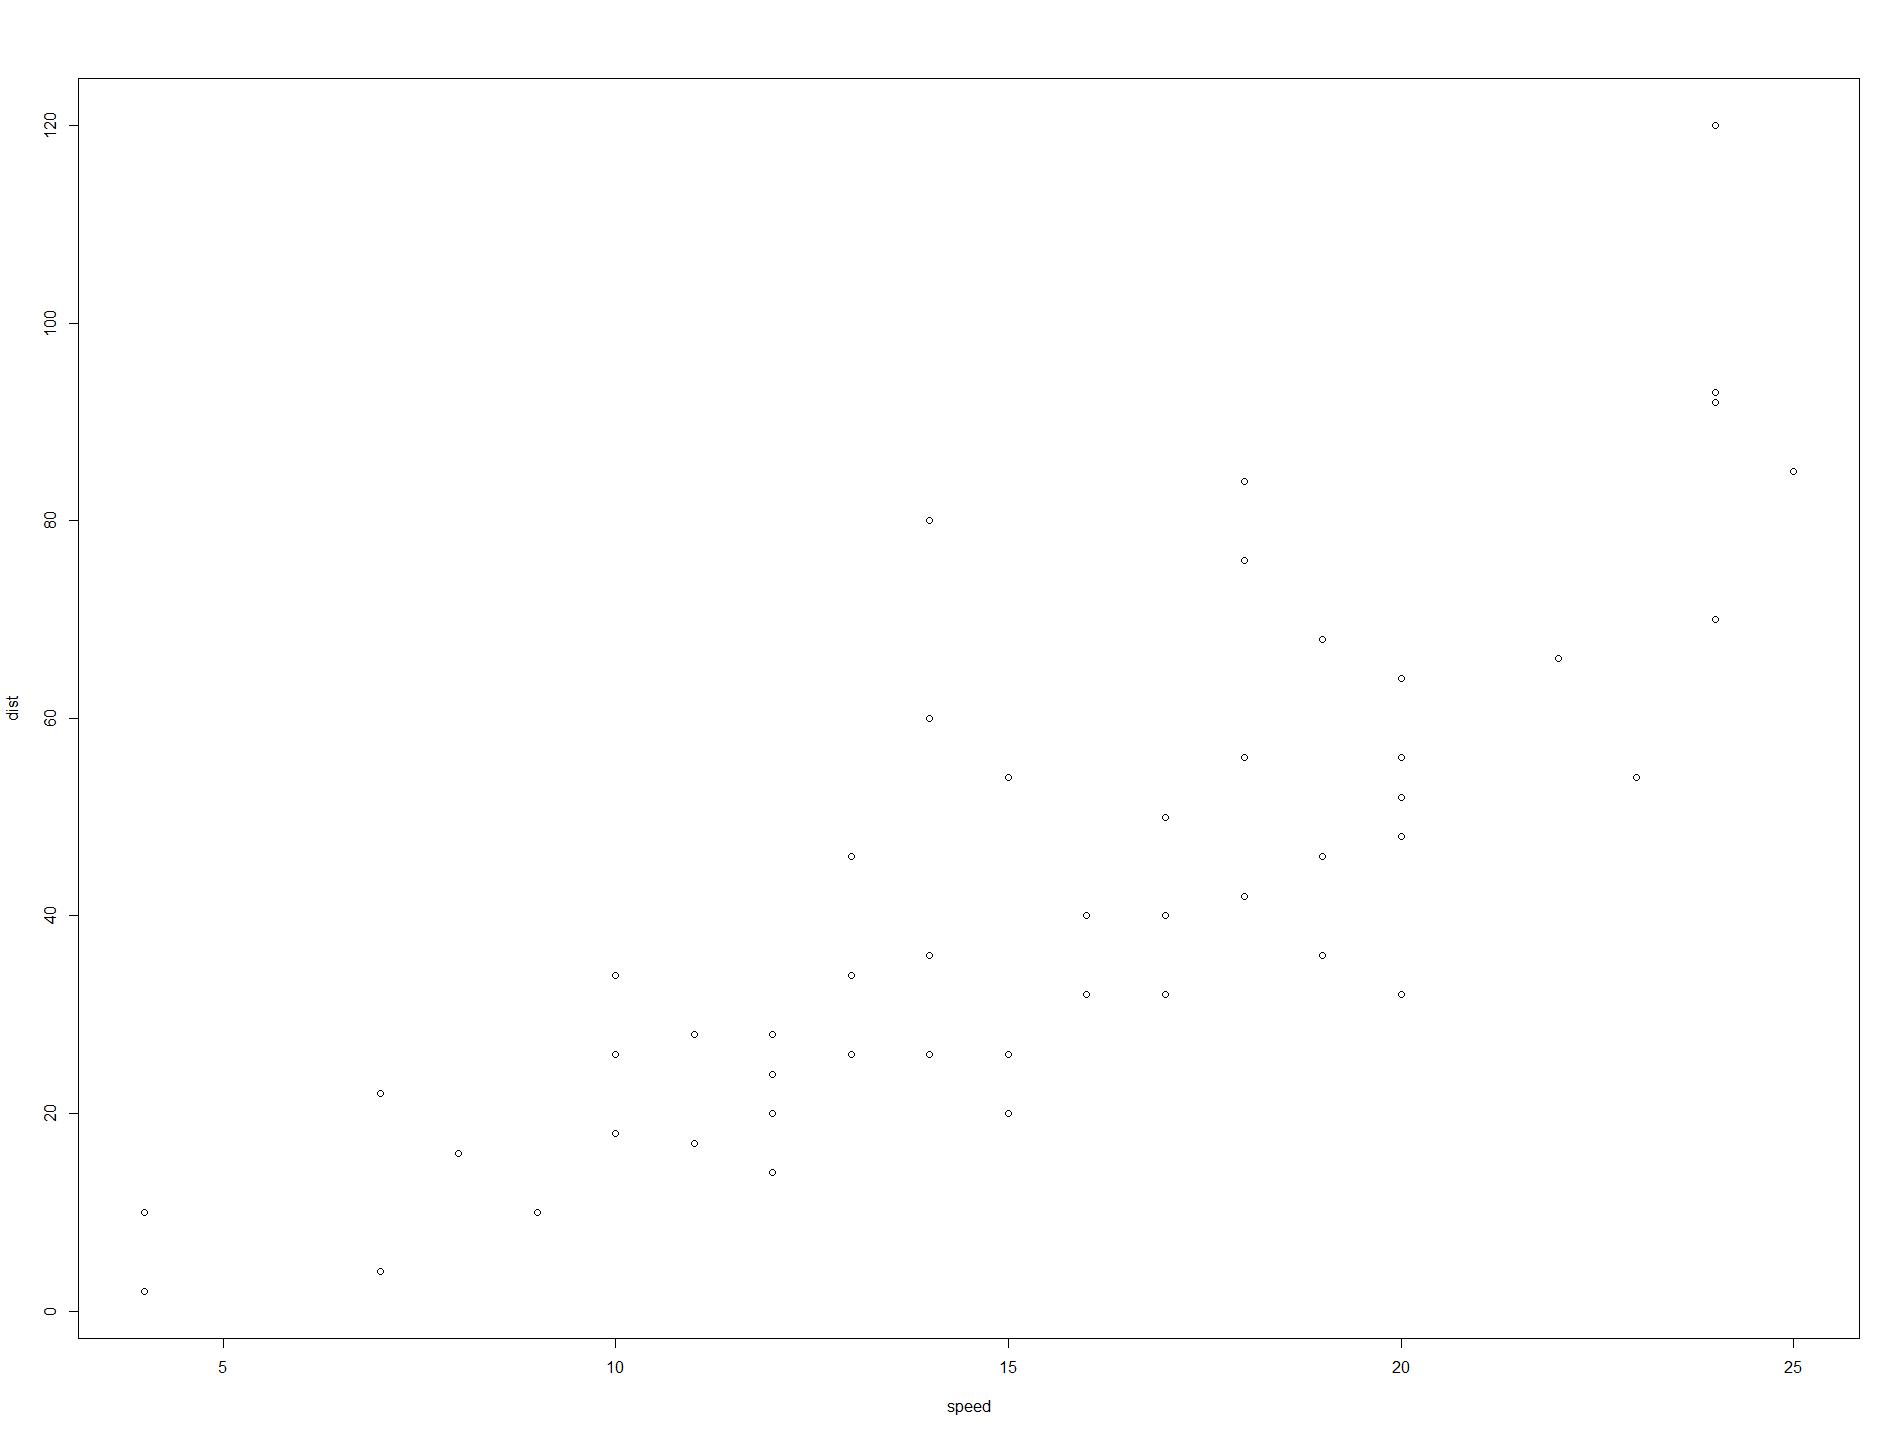
> cars
   speed dist
1      4    2
2      4   10
3      7    4
4      7   22
5      8   16
6      9   10
7     10   18
8     10   26
9     10   34
10    11   17
11    11   28
12    12   14
13    12   20
14    12   24
15    12   28
16    13   26
17    13   34
18    13   34
19    13   46
20    14   26
21    14   36
22    14   60
23    14   80
24    15   20
25    15   26
26    15   54
27    16   32
28    16   40
29    17   32
30    17   40
31    17   50
32    18   42
33    18   56
34    18   76
35    18   84
36    19   36
37    19   46
38    19   68
39    20   32
40    20   48
41    20   52
42    20   56
43    20   64
44    22   66
45    23   54
46    24   70
47    24   92
48    24   93
49    24  120
50    25   85
>
The same thig . . .
> plot(cars)
> plot(cars$speed, cars$dist)
Adding a Title and Labels
When calling plot:
- Use the main argument for a title.
- Use the xlab argument for an x-axis label.
- Use the ylab argument for a y-axis label.
> plot(x, main="The Title", xlab="X-axis Label", ylab="Y-axis Label")
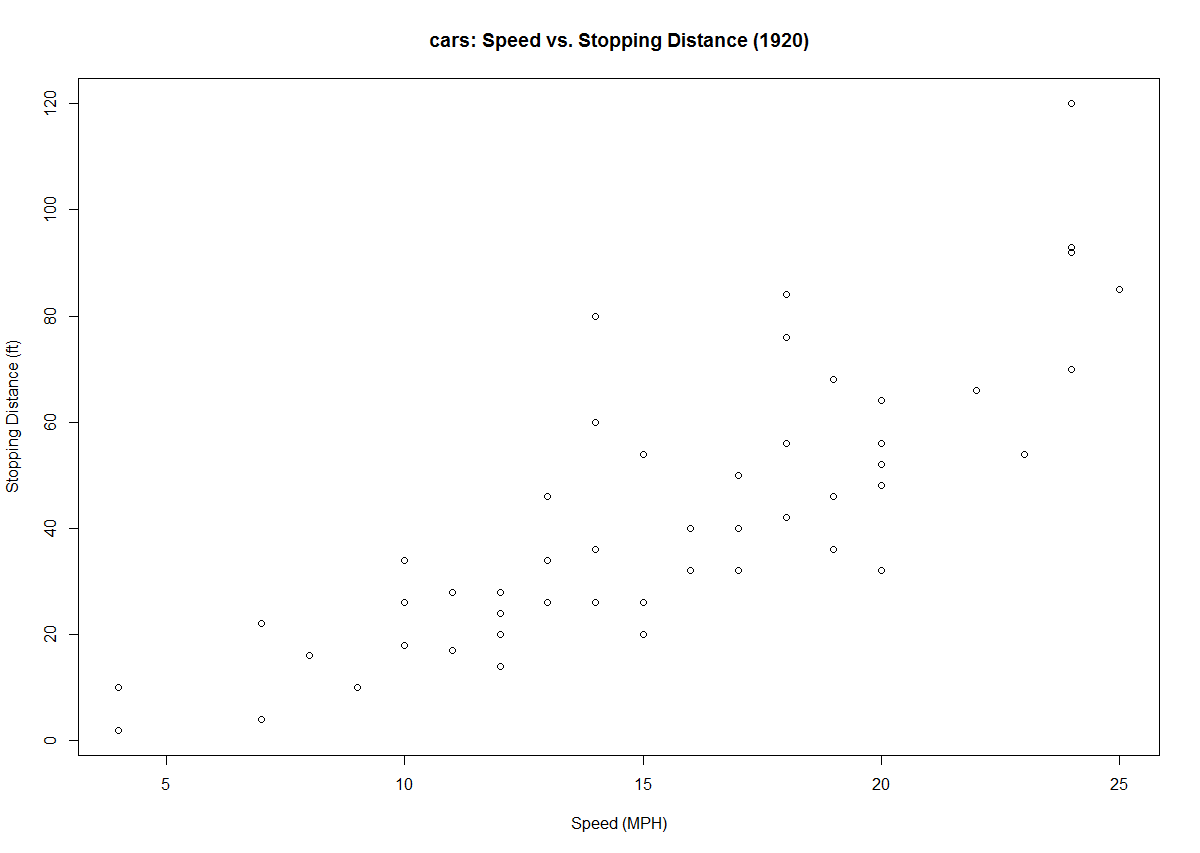
plot(cars,
            main="cars: Speed vs. Stopping Distance (1920)",
            xlab="Speed (MPH)",
            ylab="Stopping Distance (ft)")
Adding a Grid
- Call plot with type=“n” to initialize the graphics frame without displaying the data.
- Call the grid function to draw the grid.
- Call low-level graphics functions, such as points and lines, to draw the graphics overlaid on the grid.
> plot(x, y, type="n")
> grid()
> points(x, y)
plot(cars,
            main="cars: Speed vs. Stopping Distance (1920)",
            xlab="Speed (MPH)",
            ylab="Stopping Distance (ft)", type="n")
grid()
points(cars)
Creating a Scatter Plot of Multiple Groups
with(iris, plot(Petal.Length, Petal.Width))

with(iris, plot(Petal.Length, Petal.Width, pch=as.integer(Species)))
Adding a Legend
Here is how you create legends for points, lines, and colors:
Legend for points
legend(x, y, labels, pch=c(pointtype1, pointtype2, ...))
Legend for lines according to line type
legend(x, y, labels, lty=c(linetype1, linetype2, ...))
Legend for lines according to line width
legend(x, y, labels, lwd=c(width1, width2, ...))
Legend for colors
legend(x, y, labels, col=c(color1, color2, ...))
- x and y are the coordinates of the legend box.
- labels is a vector of the character strings to appear in the legend.
- The pch, lty, lwd, and col arguments are vectors that parallel the labels.
> legend(1.5, 2.4, c("setosa","versicolor","virginica"), pch=1:3)
> legend(1, 2.5, c("setosa","versicolor","virginica"), pch=1:3, col="red")
> f <- factor(iris$Species)
> with(iris, plot(Petal.Length, Petal.Width, pch=as.integer(f)))
> legend(1.5, 2.4, as.character(levels(f)),
     pch=1:length(levels(f)),
     col=c("red","blue","green"))
Plotting the Regression Line of a Scatter Plot
> install.packages("faraway")
> library(faraway)
>

> data(strongx)
> strongx
   momentum energy crossx sd
1         4  0.345    367 17
2         6  0.287    311  9
3         8  0.251    295  9
4        10  0.225    268  7
5        12  0.207    253  7
6        15  0.186    239  6
7        20  0.161    220  6
8        30  0.132    213  6
9        75  0.084    193  5
10      150  0.060    192  5

> m <- lm(crossx ~ energy, data=strongx) # get linear regression model
> plot(crossx ~ energy, data=strongx)
> abline(m)
e.g. 1
# Creating a Graph
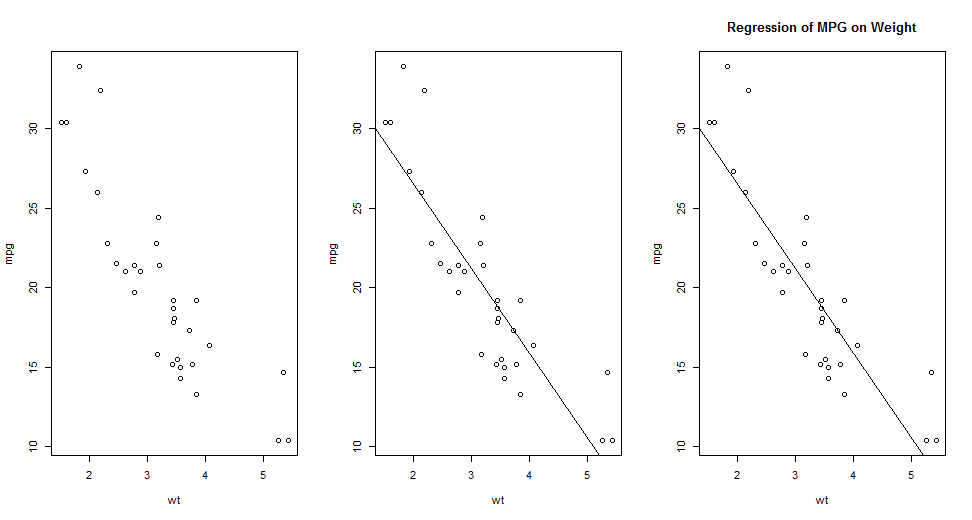
attach(mtcars)
plot(wt, mpg)
abline(lm(mpg~wt))
title("Regression of MPG on Weight")
e.g. 2
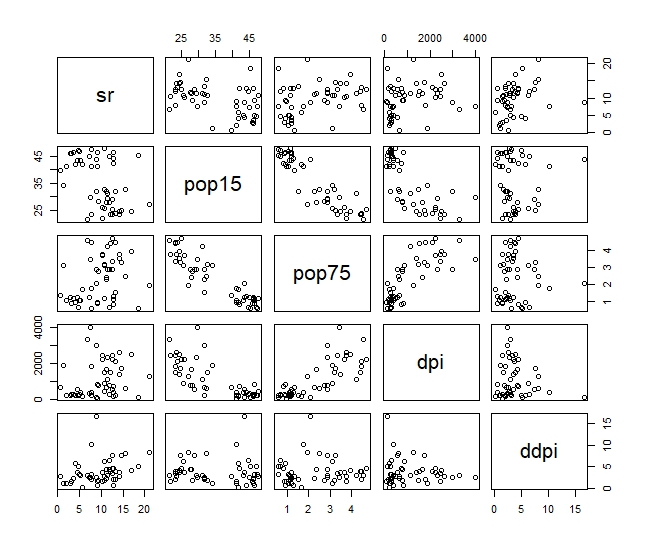
?LifeCycleSavings
lm.SR <- lm(sr ~ pop15 + pop75 + dpi + ddpi, data = LifeCycleSavings)

> summary(lm.SR)

Call:
lm(formula = sr ~ pop15 + pop75 + dpi + ddpi, data = LifeCycleSavings)

Residuals:
    Min      1Q  Median      3Q     Max
-8.2422 -2.6857 -0.2488  2.4280  9.7509

Coefficients:
              Estimate Std. Error t value Pr(>|t|)
(Intercept) 28.5660865  7.3545161   3.884 0.000334 ***
pop15       -0.4611931  0.1446422  -3.189 0.002603 **
pop75       -1.6914977  1.0835989  -1.561 0.125530
dpi         -0.0003369  0.0009311  -0.362 0.719173
ddpi         0.4096949  0.1961971   2.088 0.042471 *
---
Signif. codes:  0 ‘***’ 0.001 ‘**’ 0.01 ‘*’ 0.05 ‘.’ 0.1 ‘ ’ 1

Residual standard error: 3.803 on 45 degrees of freedom
Multiple R-squared:  0.3385,	Adjusted R-squared:  0.2797
F-statistic: 5.756 on 4 and 45 DF,  p-value: 0.0007904

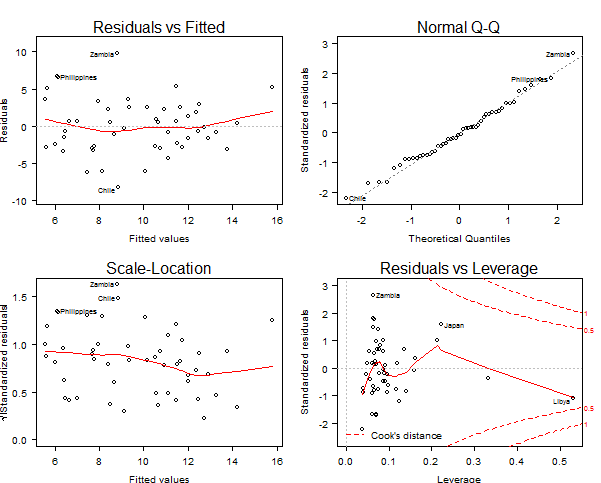
> plot(LifeCycleSavings)
> plot(lm.SR)
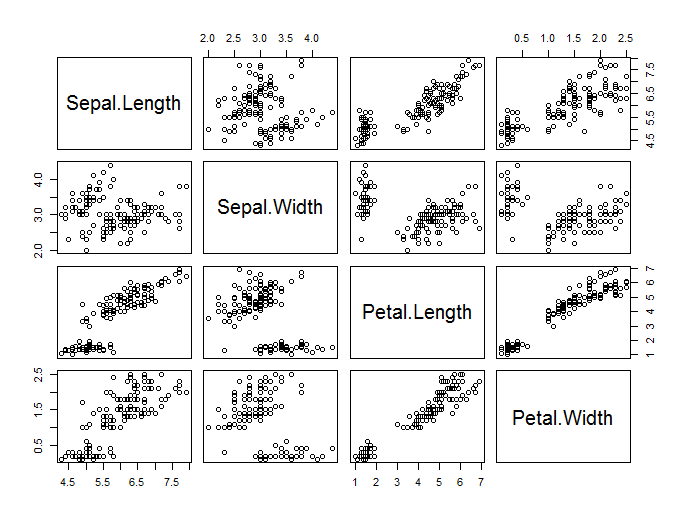
Plotting All Variables Against All Other Variables
> head(iris)
  Sepal.Length Sepal.Width Petal.Length Petal.Width Species
1          5.1         3.5          1.4         0.2  setosa
2          4.9         3.0          1.4         0.2  setosa
3          4.7         3.2          1.3         0.2  setosa
4          4.6         3.1          1.5         0.2  setosa
5          5.0         3.6          1.4         0.2  setosa
6          5.4         3.9          1.7         0.4  setosa
plot(iris[,1:4])
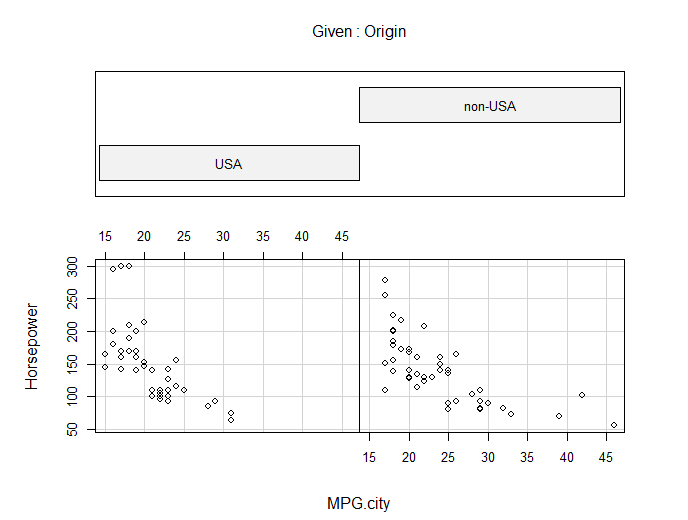
Creating One Scatter Plot for Each Factor Level
Creating a Bar Chart
> airquality
    Ozone Solar.R Wind Temp Month Day
1      41     190  7.4   67     5   1
2      36     118  8.0   72     5   2
3      12     149 12.6   74     5   3
4      18     313 11.5   62     5   4
5      NA      NA 14.3   56     5   5
6      28      NA 14.9   66     5   6
7      23     299  8.6   65     5   7
8      19      99 13.8   59     5   8
9       8      19 20.1   61     5   9
10     NA     194  8.6   69     5  10
11      7      NA  6.9   74     5  11
12     16     256  9.7   69     5  12
13     11     290  9.2   66     5  13
14     14     274 10.9   68     5  14
15     18      65 13.2   58     5  15
16     14     334 11.5   64     5  16
17     34     307 12.0   66     5  17
18      6      78 18.4   57     5  18
19     30     322 11.5   68     5  19
20     11      44  9.7   62     5  20
21      1       8  9.7   59     5  21
22     11     320 16.6   73     5  22
23      4      25  9.7   61     5  23
24     32      92 12.0   61     5  24
25     NA      66 16.6   57     5  25
26     NA     266 14.9   58     5  26
27     NA      NA  8.0   57     5  27
28     23      13 12.0   67     5  28
29     45     252 14.9   81     5  29
30    115     223  5.7   79     5  30
31     37     279  7.4   76     5  31
32     NA     286  8.6   78     6   1
33     NA     287  9.7   74     6   2
34     NA     242 16.1   67     6   3
35     NA     186  9.2   84     6   4
36     NA     220  8.6   85     6   5
37     NA     264 14.3   79     6   6
38     29     127  9.7   82     6   7
39     NA     273  6.9   87     6   8
40     71     291 13.8   90     6   9
41     39     323 11.5   87     6  10
42     NA     259 10.9   93     6  11
43     NA     250  9.2   92     6  12
44     23     148  8.0   82     6  13
45     NA     332 13.8   80     6  14
46     NA     322 11.5   79     6  15
47     21     191 14.9   77     6  16
48     37     284 20.7   72     6  17
49     20      37  9.2   65     6  18
50     12     120 11.5   73     6  19
51     13     137 10.3   76     6  20
52     NA     150  6.3   77     6  21
53     NA      59  1.7   76     6  22
54     NA      91  4.6   76     6  23
55     NA     250  6.3   76     6  24
56     NA     135  8.0   75     6  25
57     NA     127  8.0   78     6  26
58     NA      47 10.3   73     6  27
59     NA      98 11.5   80     6  28
60     NA      31 14.9   77     6  29
61     NA     138  8.0   83     6  30
62    135     269  4.1   84     7   1
63     49     248  9.2   85     7   2
64     32     236  9.2   81     7   3
65     NA     101 10.9   84     7   4
66     64     175  4.6   83     7   5
67     40     314 10.9   83     7   6
68     77     276  5.1   88     7   7
69     97     267  6.3   92     7   8
70     97     272  5.7   92     7   9
71     85     175  7.4   89     7  10
72     NA     139  8.6   82     7  11
73     10     264 14.3   73     7  12
74     27     175 14.9   81     7  13
75     NA     291 14.9   91     7  14
76      7      48 14.3   80     7  15
77     48     260  6.9   81     7  16
78     35     274 10.3   82     7  17
79     61     285  6.3   84     7  18
80     79     187  5.1   87     7  19
81     63     220 11.5   85     7  20
82     16       7  6.9   74     7  21
83     NA     258  9.7   81     7  22
84     NA     295 11.5   82     7  23
85     80     294  8.6   86     7  24
86    108     223  8.0   85     7  25
87     20      81  8.6   82     7  26
88     52      82 12.0   86     7  27
89     82     213  7.4   88     7  28
90     50     275  7.4   86     7  29
91     64     253  7.4   83     7  30
92     59     254  9.2   81     7  31
93     39      83  6.9   81     8   1
94      9      24 13.8   81     8   2
95     16      77  7.4   82     8   3
96     78      NA  6.9   86     8   4
97     35      NA  7.4   85     8   5
98     66      NA  4.6   87     8   6
99    122     255  4.0   89     8   7
100    89     229 10.3   90     8   8
101   110     207  8.0   90     8   9
102    NA     222  8.6   92     8  10
103    NA     137 11.5   86     8  11
104    44     192 11.5   86     8  12
105    28     273 11.5   82     8  13
106    65     157  9.7   80     8  14
107    NA      64 11.5   79     8  15
108    22      71 10.3   77     8  16
109    59      51  6.3   79     8  17
110    23     115  7.4   76     8  18
111    31     244 10.9   78     8  19
112    44     190 10.3   78     8  20
113    21     259 15.5   77     8  21
114     9      36 14.3   72     8  22
115    NA     255 12.6   75     8  23
116    45     212  9.7   79     8  24
117   168     238  3.4   81     8  25
118    73     215  8.0   86     8  26
119    NA     153  5.7   88     8  27
120    76     203  9.7   97     8  28
121   118     225  2.3   94     8  29
122    84     237  6.3   96     8  30
123    85     188  6.3   94     8  31
124    96     167  6.9   91     9   1
125    78     197  5.1   92     9   2
126    73     183  2.8   93     9   3
127    91     189  4.6   93     9   4
128    47      95  7.4   87     9   5
129    32      92 15.5   84     9   6
130    20     252 10.9   80     9   7
131    23     220 10.3   78     9   8
132    21     230 10.9   75     9   9
133    24     259  9.7   73     9  10
134    44     236 14.9   81     9  11
135    21     259 15.5   76     9  12
136    28     238  6.3   77     9  13
137     9      24 10.9   71     9  14
138    13     112 11.5   71     9  15
139    46     237  6.9   78     9  16
140    18     224 13.8   67     9  17
141    13      27 10.3   76     9  18
142    24     238 10.3   68     9  19
143    16     201  8.0   82     9  20
144    13     238 12.6   64     9  21
145    23      14  9.2   71     9  22
146    36     139 10.3   81     9  23
147     7      49 10.3   69     9  24
148    14      20 16.6   63     9  25
149    30     193  6.9   70     9  26
150    NA     145 13.2   77     9  27
151    14     191 14.3   75     9  28
152    18     131  8.0   76     9  29
153    20     223 11.5   68     9  30
>
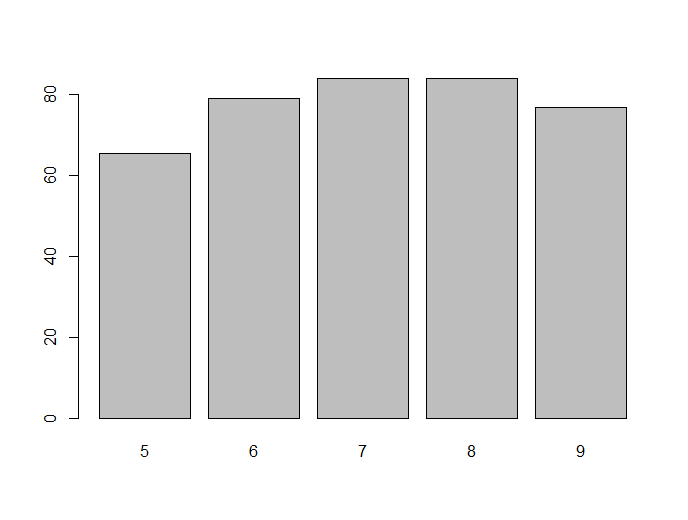
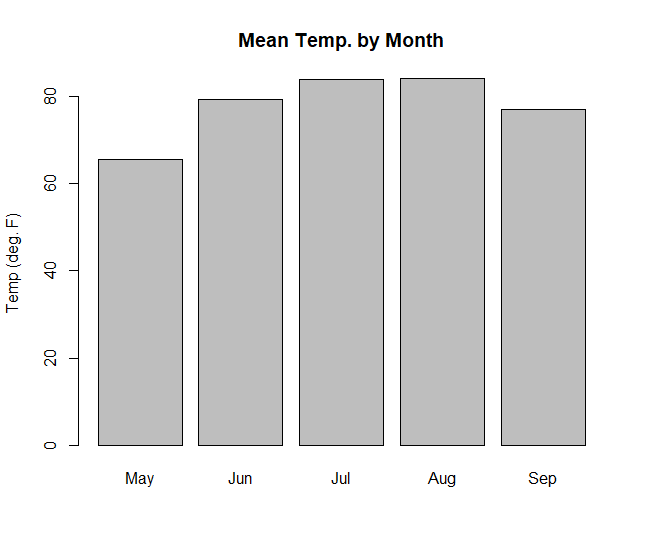
> heights <- tapply(airquality$Temp, airquality$Month, mean)
> barplot(heights)
> barplot(heights,
+         main="Mean Temp. by Month",
+         names.arg=c("May", "Jun", "Jul", "Aug", "Sep"),
+         ylab="Temp (deg. F)")
Adding Confidence Intervals to a Bar Chart
attach(airquality)
heights <- tapply(Temp, Month, mean)

install.packages("gplots")  # for barplot2 function
library(gplots) # load barplot2 function
tmean <- tapply(Temp, list(as.factor(Month)), mean)
# mean for each month
tsd <- tapply(Temp, list(as.factor(Month)),sd)
# sd for each month
tse <- tsd/sqrt(length(Temp))
# se for each month

lower <- tmean - 1.96*tse
upper <- tmean + 1.96*tse
barplot2(heights, plot.ci=TRUE, ci.l=lower, ci.u=upper)

barplot2(heights, plot.ci=TRUE, ci.l=lower, ci.u=upper,
          ylim=c(50,90), xpd=FALSE,
          main="Mean Temp. By Month",
          names.arg=c("May","Jun","Jul","Aug","Sep"),
          ylab="Temp (deg. F)")
Coloring a Bar Chart
barplot(c(3,5,4), col=c("red","white","blue"))
rel.hts <- rank(heights) / length(heights)
grays <- gray(1 - rel.hts)
barplot(heights, col=grays)
rel.hts <- (heights - min(heights)) / (max(heights) - min(heights))
grays <- gray(1 - rel.hts)
barplot(heights,
        col=grays,
        ylim=c(50,90), xpd=FALSE,
        main="Mean Temp. By Month",
        names.arg=c("May", "Jun", "Jul", "Aug", "Sep"),
        ylab="Temp (deg. F)")
Plotting a Line from x and y Points
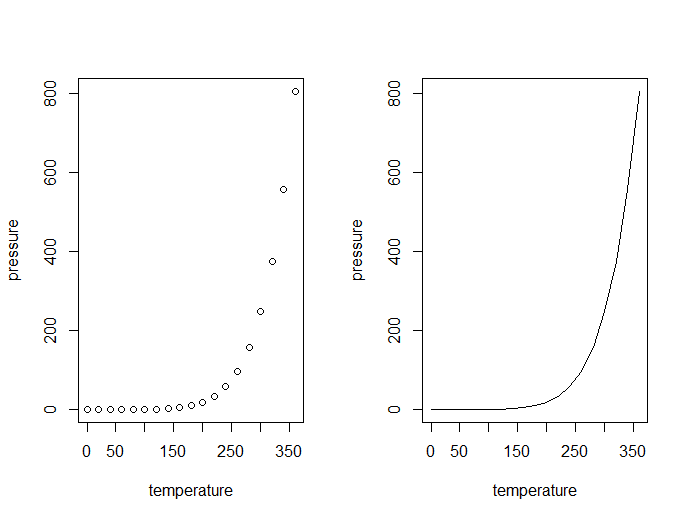
plot(pressure)
plot(pressure, type="l")
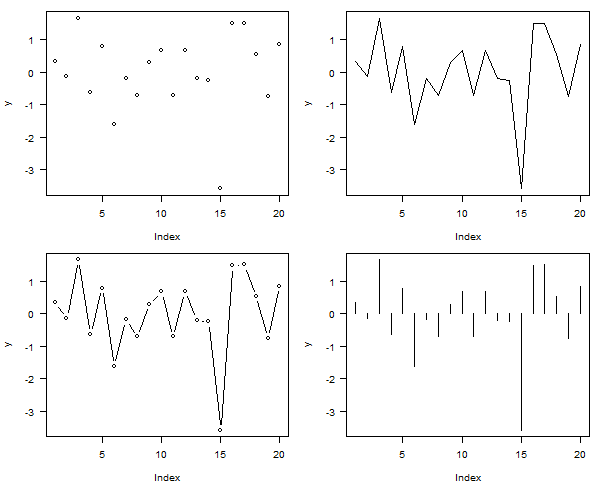
> par(mfrow=c(2, 2), cex=0.6, mar=c(4, 4, 1, 1))
> y <- rnorm(20)
> plot(y, type="p")
> plot(y, type="l")
> plot(y, type="b")
> plot(y, type="h")
>
Plotting Multiple Datasets
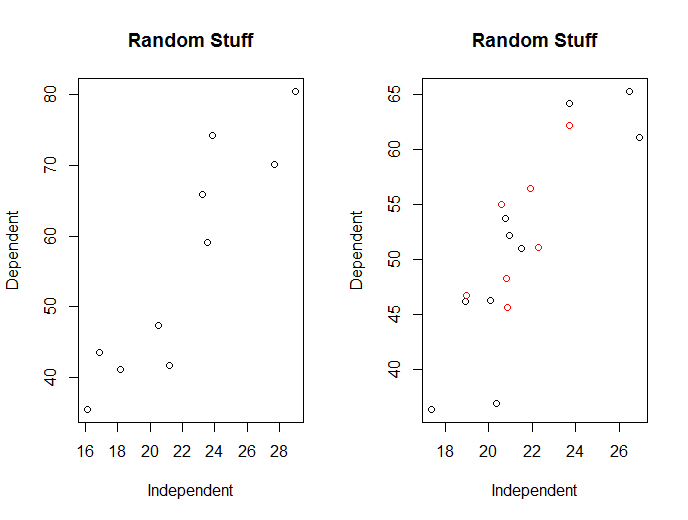
x <- rnorm(10,sd=5,mean=20)
y <- 2.5*x - 1.0 + rnorm(10,sd=9,mean=0)
cor(x,y)
[1] 0.7400576
plot(x,y,xlab="Independent",ylab="Dependent",main="Random Stuff")
x1 <- runif(8,15,25)
y1 <- 2.5*x1 - 1.0 + runif(8,-6,6)
points(x1,y1,col=2)
Adding Vertical or Horizontal Lines
> abline(v=0)          # Vertical line at x = 0
> abline(h=0)          # Horizontal line at y = 0
Creating a Box Plot
boxplot(x), where x is a vector of numeric values.
boxplot(Cars93$MPG.city)
Creating One Box Plot for Each Factor Level
boxplot(Cars93$MPG.city~Cars93$Origin)
> library(MASS)
> UScereal
mfr calories protein
100% Bran N 212.12121 12.1212121
All-Bran K 212.12121 12.1212121
All-Bran with Extra Fiber K 100.00000 8.0000000
Apple Cinnamon Cheerios G 146.66667 2.6666667
Apple Jacks K 110.00000 2.0000000
Basic 4 G 173.33333 4.0000000
Bran Chex R 134.32836 2.9850746
Bran Flakes P 134.32836 4.4776119
Cap'n'Crunch Q 160.00000 1.3333333
Cheerios G 88.00000 4.8000000
Cinnamon Toast Crunch G 160.00000 1.3333333
Clusters G 220.00000 6.0000000
Cocoa Puffs G 110.00000 1.0000000
Corn Chex R 110.00000 2.0000000
Corn Flakes K 100.00000 2.0000000
Corn Pops K 110.00000 1.0000000
Count Chocula G 110.00000 1.0000000
Cracklin' Oat Bran K 220.00000 6.0000000
Crispix K 110.00000 2.0000000
Crispy Wheat & Raisins G 133.33333 2.6666667
Double Chex R 133.33333 2.6666667
Froot Loops K 110.00000 2.0000000
Frosted Flakes K 146.66667 1.3333333
Frosted Mini-Wheats K 125.00000 3.7500000
Fruit & Fibre: Dates Walnuts and Oats P 179.10448 4.4776119
Fruitful Bran K 179.10448 4.4776119
Fruity Pebbles P 146.66667 1.3333333
Golden Crisp P 113.63636 2.2727273
Golden Grahams G 146.66667 1.3333333
Grape Nuts Flakes P 113.63636 3.4090909
Grape-Nuts P 440.00000 12.0000000
Great Grains Pecan P 363.63636 9.0909091
Honey Graham Ohs Q 120.00000 1.0000000
Honey Nut Cheerios G 146.66667 4.0000000
Honey-comb P 82.70677 0.7518797
Just Right Fruit & Nut K 186.66667 4.0000000
Kix G 73.33333 1.3333333
Life Q 149.25373 5.9701493
Lucky Charms G 110.00000 2.0000000
Mueslix Crispy Blend K 238.80597 4.4776119
Multi-Grain Cheerios G 100.00000 2.0000000
Nut&Honey Crunch K 179.10448 2.9850746
Nutri-Grain Almond-Raisin K 208.95522 4.4776119
Oatmeal Raisin Crisp G 260.00000 6.0000000
Post Nat. Raisin Bran P 179.10448 4.4776119
Product 19 K 100.00000 3.0000000
Puffed Rice Q 50.00000 1.0000000
Quaker Oat Squares Q 200.00000 8.0000000
Raisin Bran K 160.00000 4.0000000
Raisin Nut Bran G 200.00000 6.0000000
Raisin Squares K 180.00000 4.0000000
Rice Chex R 97.34513 0.8849558
Rice Krispies K 110.00000 2.0000000
Shredded Wheat 'n'Bran N 134.32836 4.4776119
Shredded Wheat spoon size N 134.32836 4.4776119
Smacks K 146.66667 2.6666667
Special K K 110.00000 6.0000000
Total Corn Flakes G 110.00000 2.0000000
Total Raisin Bran G 140.00000 3.0000000
Total Whole Grain G 100.00000 3.0000000
Triples G 146.66667 2.6666667
Trix G 110.00000 1.0000000
Wheat Chex R 149.25373 4.4776119
Wheaties G 100.00000 3.0000000
Wheaties Honey Gold G 146.66667 2.6666667
fat sodium fibre
100% Bran 3.0303030 393.93939 30.303030
All-Bran 3.0303030 787.87879 27.272727
All-Bran with Extra Fiber 0.0000000 280.00000 28.000000
Apple Cinnamon Cheerios 2.6666667 240.00000 2.000000
Apple Jacks 0.0000000 125.00000 1.000000
Basic 4 2.6666667 280.00000 2.666667
Bran Chex 1.4925373 298.50746 5.970149
Bran Flakes 0.0000000 313.43284 7.462687
Cap'n'Crunch 2.6666667 293.33333 0.000000
Cheerios 1.6000000 232.00000 1.600000
Cinnamon Toast Crunch 4.0000000 280.00000 0.000000
Clusters 4.0000000 280.00000 4.000000
Cocoa Puffs 1.0000000 180.00000 0.000000
Corn Chex 0.0000000 280.00000 0.000000
Corn Flakes 0.0000000 290.00000 1.000000
Corn Pops 0.0000000 90.00000 1.000000
Count Chocula 1.0000000 180.00000 0.000000
Cracklin' Oat Bran 6.0000000 280.00000 8.000000
Crispix 0.0000000 220.00000 1.000000
Crispy Wheat & Raisins 1.3333333 186.66667 2.666667
Double Chex 0.0000000 253.33333 1.333333
Froot Loops 1.0000000 125.00000 1.000000
Frosted Flakes 0.0000000 266.66667 1.333333
Frosted Mini-Wheats 0.0000000 0.00000 3.750000
Fruit & Fibre: Dates Walnuts and Oats 2.9850746 238.80597 7.462687
Fruitful Bran 0.0000000 358.20896 7.462687
Fruity Pebbles 1.3333333 180.00000 0.000000
Golden Crisp 0.0000000 51.13636 0.000000
Golden Grahams 1.3333333 373.33333 0.000000
Grape Nuts Flakes 1.1363636 159.09091 3.409091
Grape-Nuts 0.0000000 680.00000 12.000000
Great Grains Pecan 9.0909091 227.27273 9.090909
Honey Graham Ohs 2.0000000 220.00000 1.000000
Honey Nut Cheerios 1.3333333 333.33333 2.000000
Honey-comb 0.0000000 135.33835 0.000000
Just Right Fruit & Nut 1.3333333 226.66667 2.666667
Kix 0.6666667 173.33333 0.000000
Life 2.9850746 223.88060 2.985075
Lucky Charms 1.0000000 180.00000 0.000000
Mueslix Crispy Blend 2.9850746 223.88060 4.477612
Multi-Grain Cheerios 1.0000000 220.00000 2.000000
Nut&Honey Crunch 1.4925373 283.58209 0.000000
Nutri-Grain Almond-Raisin 2.9850746 328.35821 4.477612
Oatmeal Raisin Crisp 4.0000000 340.00000 3.000000
Post Nat. Raisin Bran 1.4925373 298.50746 8.955224
Product 19 0.0000000 320.00000 1.000000
Puffed Rice 0.0000000 0.00000 0.000000
Quaker Oat Squares 2.0000000 270.00000 4.000000
Raisin Bran 1.3333333 280.00000 6.666667
Raisin Nut Bran 4.0000000 280.00000 5.000000
Raisin Squares 0.0000000 0.00000 4.000000
Rice Chex 0.0000000 212.38938 0.000000
Rice Krispies 0.0000000 290.00000 0.000000
Shredded Wheat 'n'Bran 0.0000000 0.00000 5.970149
Shredded Wheat spoon size 0.0000000 0.00000 4.477612
Smacks 1.3333333 93.33333 1.333333
Special K 0.0000000 230.00000 1.000000
Total Corn Flakes 1.0000000 200.00000 0.000000
Total Raisin Bran 1.0000000 190.00000 4.000000
Total Whole Grain 1.0000000 200.00000 3.000000
Triples 1.3333333 333.33333 0.000000
Trix 1.0000000 140.00000 0.000000
Wheat Chex 1.4925373 343.28358 4.477612
Wheaties 1.0000000 200.00000 3.000000
Wheaties Honey Gold 1.3333333 266.66667 1.333333
carbo sugars shelf
100% Bran 15.15152 18.181818 3
All-Bran 21.21212 15.151515 3
All-Bran with Extra Fiber 16.00000 0.000000 3
Apple Cinnamon Cheerios 14.00000 13.333333 1
Apple Jacks 11.00000 14.000000 2
Basic 4 24.00000 10.666667 3
Bran Chex 22.38806 8.955224 1
Bran Flakes 19.40299 7.462687 3
Cap'n'Crunch 16.00000 16.000000 2
Cheerios 13.60000 0.800000 1
Cinnamon Toast Crunch 17.33333 12.000000 2
Clusters 26.00000 14.000000 3
Cocoa Puffs 12.00000 13.000000 2
Corn Chex 22.00000 3.000000 1
Corn Flakes 21.00000 2.000000 1
Corn Pops 13.00000 12.000000 2
Count Chocula 12.00000 13.000000 2
Cracklin' Oat Bran 20.00000 14.000000 3
Crispix 21.00000 3.000000 3
Crispy Wheat & Raisins 14.66667 13.333333 3
Double Chex 24.00000 6.666667 3
Froot Loops 11.00000 13.000000 2
Frosted Flakes 18.66667 14.666667 1
Frosted Mini-Wheats 17.50000 8.750000 2
Fruit & Fibre: Dates Walnuts and Oats 17.91045 14.925373 3
Fruitful Bran 20.89552 17.910448 3
Fruity Pebbles 17.33333 16.000000 2
Golden Crisp 12.50000 17.045455 1
Golden Grahams 20.00000 12.000000 2
Grape Nuts Flakes 17.04545 5.681818 3
Grape-Nuts 68.00000 12.000000 3
Great Grains Pecan 39.39394 12.121212 3
Honey Graham Ohs 12.00000 11.000000 2
Honey Nut Cheerios 15.33333 13.333333 1
Honey-comb 10.52632 8.270677 1
Just Right Fruit & Nut 26.66667 12.000000 3
Kix 14.00000 2.000000 2
Life 17.91045 8.955224 2
Lucky Charms 12.00000 12.000000 2
Mueslix Crispy Blend 25.37313 19.402985 3
Multi-Grain Cheerios 15.00000 6.000000 1
Nut&Honey Crunch 22.38806 13.432836 2
Nutri-Grain Almond-Raisin 31.34328 10.447761 3
Oatmeal Raisin Crisp 27.00000 20.000000 3
Post Nat. Raisin Bran 16.41791 20.895522 3
Product 19 20.00000 3.000000 3
Puffed Rice 13.00000 0.000000 3
Quaker Oat Squares 28.00000 12.000000 3
Raisin Bran 18.66667 16.000000 2
Raisin Nut Bran 21.00000 16.000000 3
Raisin Squares 30.00000 12.000000 3
Rice Chex 20.35398 1.769912 1
Rice Krispies 22.00000 3.000000 1
Shredded Wheat 'n'Bran 28.35821 0.000000 1
Shredded Wheat spoon size 29.85075 0.000000 1
Smacks 12.00000 20.000000 2
Special K 16.00000 3.000000 1
Total Corn Flakes 21.00000 3.000000 3
Total Raisin Bran 15.00000 14.000000 3
Total Whole Grain 16.00000 3.000000 3
Triples 28.00000 4.000000 3
Trix 13.00000 12.000000 2
Wheat Chex 25.37313 4.477612 1
Wheaties 17.00000 3.000000 1
Wheaties Honey Gold 21.33333 10.666667 1
potassium vitamins
100% Bran 848.48485 enriched
All-Bran 969.69697 enriched
All-Bran with Extra Fiber 660.00000 enriched
Apple Cinnamon Cheerios 93.33333 enriched
Apple Jacks 30.00000 enriched
Basic 4 133.33333 enriched
Bran Chex 186.56716 enriched
Bran Flakes 283.58209 enriched
Cap'n'Crunch 46.66667 enriched
Cheerios 84.00000 enriched
Cinnamon Toast Crunch 60.00000 enriched
Clusters 210.00000 enriched
Cocoa Puffs 55.00000 enriched
Corn Chex 25.00000 enriched
Corn Flakes 35.00000 enriched
Corn Pops 20.00000 enriched
Count Chocula 65.00000 enriched
Cracklin' Oat Bran 320.00000 enriched
Crispix 30.00000 enriched
Crispy Wheat & Raisins 160.00000 enriched
Double Chex 106.66667 enriched
Froot Loops 30.00000 enriched
Frosted Flakes 33.33333 enriched
Frosted Mini-Wheats 125.00000 enriched
Fruit & Fibre: Dates Walnuts and Oats 298.50746 enriched
Fruitful Bran 283.58209 enriched
Fruity Pebbles 33.33333 enriched
Golden Crisp 45.45455 enriched
Golden Grahams 60.00000 enriched
Grape Nuts Flakes 96.59091 enriched
Grape-Nuts 360.00000 enriched
Great Grains Pecan 303.03030 enriched
Honey Graham Ohs 45.00000 enriched
Honey Nut Cheerios 120.00000 enriched
Honey-comb 26.31579 enriched
Just Right Fruit & Nut 126.66667 100%
Kix 26.66667 enriched
Life 141.79104 enriched
Lucky Charms 55.00000 enriched
Mueslix Crispy Blend 238.80597 enriched
Multi-Grain Cheerios 90.00000 enriched
Nut&Honey Crunch 59.70149 enriched
Nutri-Grain Almond-Raisin 194.02985 enriched
Oatmeal Raisin Crisp 240.00000 enriched
Post Nat. Raisin Bran 388.05970 enriched
Product 19 45.00000 100%
Puffed Rice 15.00000 none
Quaker Oat Squares 220.00000 enriched
Raisin Bran 320.00000 enriched
Raisin Nut Bran 280.00000 enriched
Raisin Squares 220.00000 enriched
Rice Chex 26.54867 enriched
Rice Krispies 35.00000 enriched
Shredded Wheat 'n'Bran 208.95522 none
Shredded Wheat spoon size 179.10448 none
Smacks 53.33333 enriched
Special K 55.00000 enriched
Total Corn Flakes 35.00000 100%
Total Raisin Bran 230.00000 100%
Total Whole Grain 110.00000 100%
Triples 80.00000 enriched
Trix 25.00000 enriched
Wheat Chex 171.64179 enriched
Wheaties 110.00000 enriched
Wheaties Honey Gold 80.00000 enriched
>
boxplot(sugars ~ shelf, data=UScereal)
boxplot(sugars ~ shelf, data=UScereal,
        main="Sugar Content by Shelf",
        xlab="Shelf", ylab="Sugar (grams per portion)")
Creating a Histogram
Use hist(x), where x is a vector of numeric values.
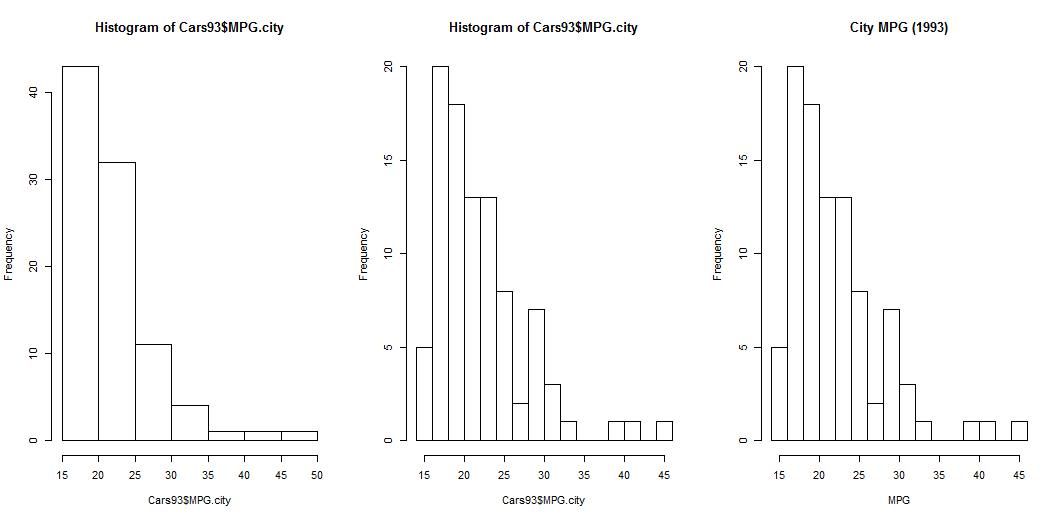
data(Cars93, package="MASS")
hist(Cars93$MPG.city)
hist(Cars93$MPG.city, 20)
hist(Cars93$MPG.city, 20, main="City MPG (1993)", xlab="MPG")
Creating a Normal Quantile-Quantile (Q-Q) Plot
data(Cars93, package="MASS")
qqnorm(Cars93$Price, main="Q-Q Plot: Price")
qqline(Cars93$Price)
data(Cars93, package="MASS")
qqnorm(log(Cars93$Price), main="Q-Q Plot: log(Price)")
qqline(log(Cars93$Price))
E.G.
#
#  Comment:
#
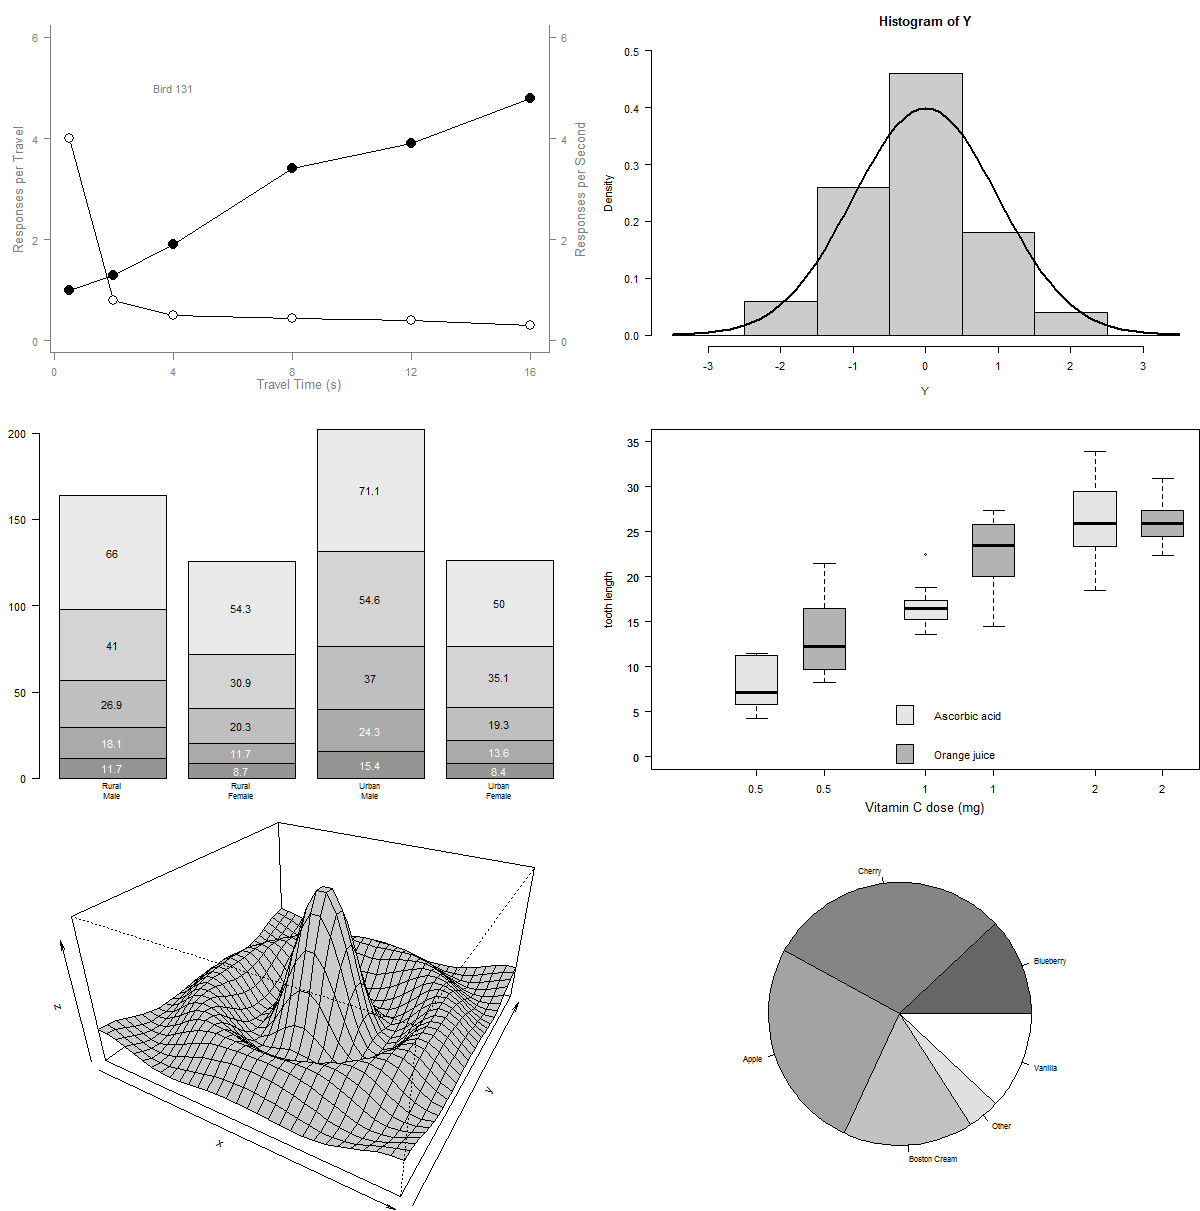
#  Examples of the use of standard high-level plotting functions.
#
#  In each case, extra output is also added using low-level
#  plotting functions.
#


par(mfrow=c(3, 2))

# Scatterplot
x <- c(0.5, 2, 4, 8, 12, 16)
y1 <- c(1, 1.3, 1.9, 3.4, 3.9, 4.8)
y2 <- c(4, .8, .5, .45, .4, .3)
par(las=1, mar=c(4, 4, 2, 4))
plot.new()
plot.window(range(x), c(0, 6))
lines(x, y1)
lines(x, y2)
points(x, y1, pch=16, cex=2)
points(x, y2, pch=21, bg="white", cex=2)
par(col="grey50", fg="grey50", col.axis="grey50")
axis(1, at=seq(0, 16, 4))
axis(2, at=seq(0, 6, 2))
axis(4, at=seq(0, 6, 2))
box(bty="u")
mtext("Travel Time (s)", side=1, line=2, cex=0.8)
mtext("Responses per Travel", side=2, line=2, las=0, cex=0.8)
mtext("Responses per Second", side=4, line=2, las=0, cex=0.8)
text(4, 5, "Bird 131")
par(mar=c(5.1, 4.1, 4.1, 2.1), col="black", fg="black", col.axis="black")

# Histogram
# Random data
Y <- rnorm(50)
# Make sure no Y exceed [-3.5, 3.5]
Y[Y < -3.5 | Y > 3.5] <- NA
x <- seq(-3.5, 3.5, .1)
dn <- dnorm(x)
par(mar=c(4.5, 4.1, 3.1, 0))
hist(Y, breaks=seq(-3.5, 3.5), ylim=c(0, 0.5),
     col="grey80", freq=FALSE)
lines(x, dnorm(x), lwd=2)
par(mar=c(5.1, 4.1, 4.1, 2.1))

# Barplot
# Modified from example(barplot)
par(mar=c(2, 3.1, 2, 2.1))
midpts <- barplot(VADeaths, col=grey(0.5 + 1:5/12),
                  names=rep("", 4))
mtext(sub(" ", "\n", colnames(VADeaths)),
      at=midpts, side=1, line=0.5, cex=0.5)
text(rep(midpts, each=5), apply(VADeaths, 2, cumsum) - VADeaths/2,
     VADeaths, col=rep(c("white", "black"), times=2:3, cex=0.8))
par(mar=c(5.1, 4.1, 4.1, 2.1))

# Boxplot
# Modified example(boxplot) - itself from suggestion by Roger Bivand
par(mar=c(3, 4.1, 2, 0))
     boxplot(len ~ dose, data = ToothGrowth,
             boxwex = 0.25, at = 1:3 - 0.2,
             subset= supp == "VC", col="grey90",
             xlab="",
             ylab="tooth length", ylim=c(0,35))
     mtext("Vitamin C dose (mg)", side=1, line=2.5, cex=0.8)
     boxplot(len ~ dose, data = ToothGrowth, add = TRUE,
             boxwex = 0.25, at = 1:3 + 0.2,
             subset= supp == "OJ", col="grey70")
     legend(1.5, 9, c("Ascorbic acid", "Orange juice"), bty="n",
            fill = c("grey90", "grey70"))
par(mar=c(5.1, 4.1, 4.1, 2.1))

# Persp
# Almost exactly example(persp)
    x <- seq(-10, 10, length= 30)
     y <- x
     f <- function(x,y) { r <- sqrt(x^2+y^2); 10 * sin(r)/r }
     z <- outer(x, y, f)
     z[is.na(z)] <- 1
# 0.5 to include z axis label
par(mar=c(0, 0.5, 0, 0), lwd=0.1)
     persp(x, y, z, theta = 30, phi = 30, expand = 0.5, col = "grey80")
par(mar=c(5.1, 4.1, 4.1, 2.1), lwd=1)

# Piechart
# Example 4 from help(pie)
par(mar=c(0, 2, 1, 2), xpd=FALSE, cex=0.5)
     pie.sales <- c(0.12, 0.3, 0.26, 0.16, 0.04, 0.12)
     names(pie.sales) <- c("Blueberry", "Cherry",
         "Apple", "Boston Cream", "Other", "Vanilla")
     pie(pie.sales, col = gray(seq(0.4,1.0,length=6)))
#
# Comment:
#
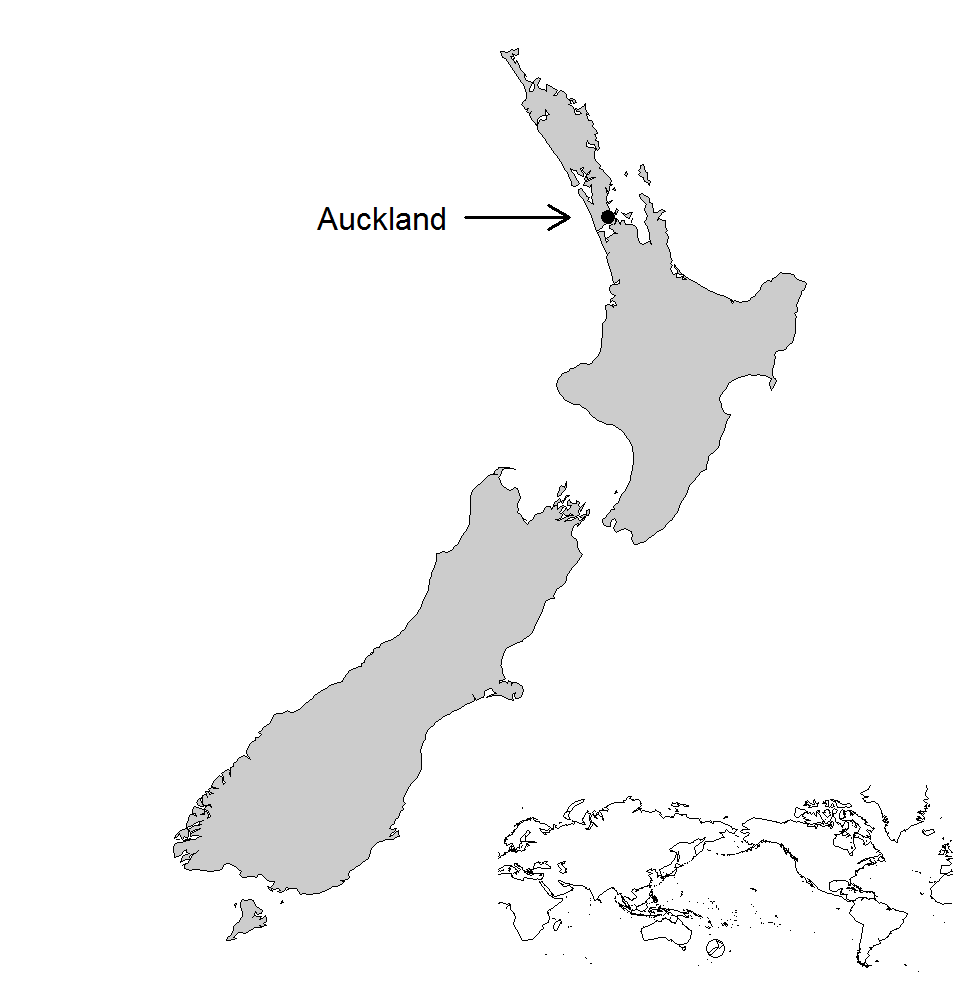
# A bit of mucking around is required to get the second (whole-world)
# map positioned correctly;  this provides an example of calling a
# plotting function to perform calculations but do no drawing (see the
# second call to the map() function).
#
# Makes use of the "maps" and "mapproj" packages to draw the maps.
#


library(maps)
par(mar=rep(0, 4))
map("nz", fill=TRUE, col="grey80")
points(174.75, -36.87, pch=16, cex=2)
arrows(172, -36.87, 174, -36.87, lwd=3)
text(172, -36.87, "Auckland  ", adj=1, cex=2)
# mini world map as guide
maplocs <- map(projection="sp_mercator", wrap=TRUE, lwd=0.1,
               col="grey", ylim=c(-60, 75),
               interior=FALSE, orientation=c(90, 180, 0), add=TRUE,
               plot=FALSE)
xrange <- range(maplocs$x, na.rm=TRUE)
yrange <- range(maplocs$y, na.rm=TRUE)
aspect <- abs(diff(yrange))/abs(diff(xrange))
# customised to 6.5 by 4.5 figure size
par(fig=c(0.99 - 0.5, 0.99, 0.01, 0.01 + 0.5*aspect*4.5/6.5),
    mar=rep(0, 4), new=TRUE)
plot.new()
plot.window(xlim=xrange,
            ylim=yrange)
map(projection="sp_mercator", wrap=TRUE, lwd=0.1, ylim=c(-60, 75),
    interior=FALSE, orientation=c(90, 180, 0), add=TRUE)
symbols(-.13, -0.8, circles=1, inches=0.1, add=TRUE)
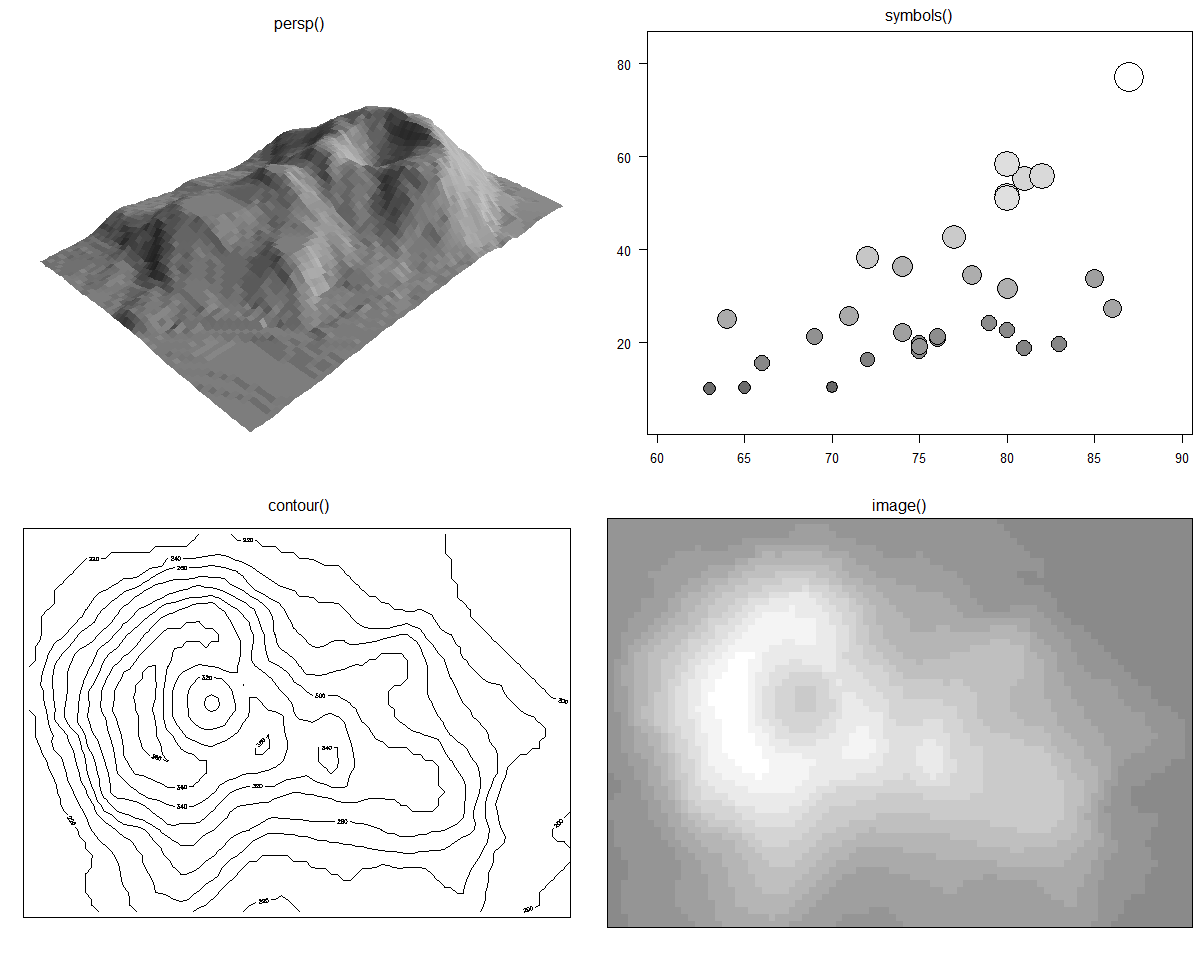
par(mfrow=c(2, 2))
z <- 2 * volcano        # Exaggerate the relief
x <- 10 * (1:nrow(z))   # 10 meter spacing (S to N)
y <- 10 * (1:ncol(z))   # 10 meter spacing (E to W)
# Don't draw the grid lines :  border = NA
par(mar=rep(0, 4))
persp(x, y, z, theta = 135, phi = 30, col = "light grey", scale = FALSE,
      ltheta = -120, shade = 0.75, border = NA, box = FALSE)
mtext("persp()", side=3, line=-2)
par(mar=c(3, 3, 2, 0.5))
# Note that  example(trees)  shows more sensible plots!
N <- nrow(trees)
attach(trees)
# Girth is diameter in inches
symbols(Height, Volume, circles=Girth/24, inches=FALSE,
        main="", xlab="", ylab="", bg=grey(Girth/max(Girth)))
mtext("symbols()", side=3, line=0.5)
par(mar=rep(0.5, 4))
contour(x, y, z, asp=1, labcex=0.35, axes=FALSE)
rect(0, 0, 870, 620)
mtext("contour()", side=3, line=-1.5)
image(x, y, z, asp=1, col=grey(0.5 + 1:12/24), xlab="", ylab="", axes=FALSE)
rect(min(x)-5, min(y)-5, max(x)+5, max(y)+5)
mtext("image()", side=3, line=-1.5)
