m <- mean(mtcars$mpg)
m <- round(m,3)
leg.m <- paste("grand mean: ", m)
k <- tapply(mtcars$mpg, mtcars$am, mean)
k <- round(k,3)
leg.1 <- paste("auto,0: ", k[1])
leg.2 <- paste("manual,1: ", k[2])

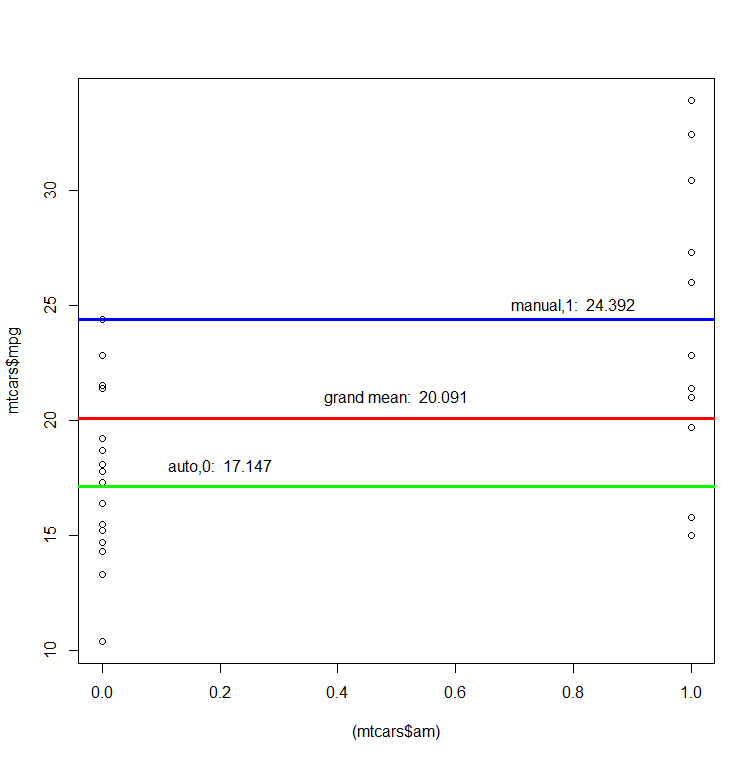
plot(x=(mtcars$am), mtcars$mpg)
abline(h=mean(mtcars$mpg), lwd=3, col='red')
abline(h=k[1], lwd=3, col='green')
abline(h=k[2], lwd=3, col='blue')
text(x = .2, y = 18, leg.1)
text(x = .8, y = 25, leg.2)
text(x = .5, y = 21, leg.m)
