Table of Contents
Gradient Descent
R code: Idea
library(tidyverse)
library(data.table)
library(ggplot2)
library(ggpmisc)

rm(list=ls())
# set.seed(191)
nx <- 200
mx <- 4.5
sdx <- mx * 0.56
x <- rnorm(nx, mx, sdx)
slp <- 12
y <-  slp * x + rnorm(nx, 0, slp*sdx*3)

data <- data.frame(x, y)

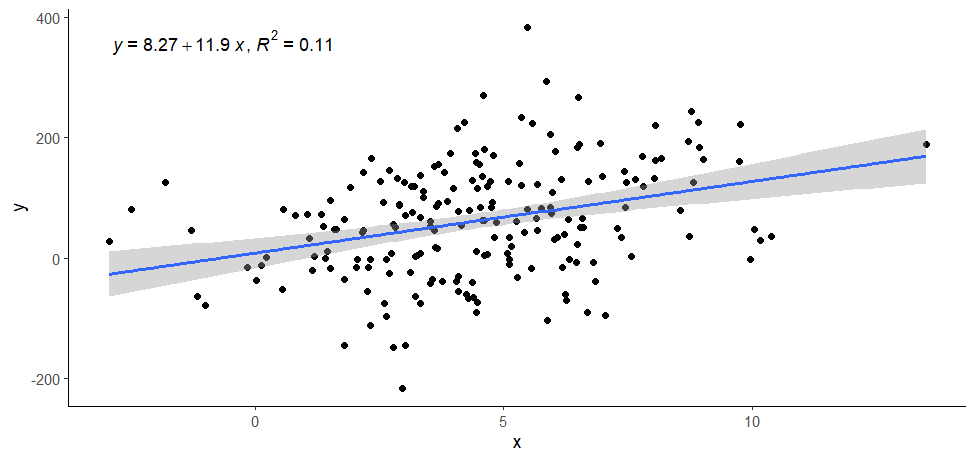
mo <- lm(y ~ x, data = data)
summary(mo)

ggplot(data = data, aes(x = x, y = y)) +
  geom_point() +
  stat_poly_line() +
  stat_poly_eq(use_label(c("eq", "R2"))) +
  theme_classic()
# set.seed(191)
# Initialize random betas
# 우선 b를 고정하고 a만
# 변화시켜서 이해
b <- summary(mo)$coefficients[2]
a <- 0

b.init <- b
a.init <- a

# Predict function:
predict <- function(x, a, b){
  return (a + b * x)
}

# And loss function is:
residuals <- function(predictions, y) {
  return(y - predictions)
}

# we use sum of square of error which oftentimes become big
ssrloss <- function(predictions, y) {
  residuals <- (y - predictions)
  return(sum(residuals^2))
}

ssrs <- c() # for sum  of square residuals
srs <- c() # sum of residuals
as <- c() # for as (intercepts)

for (i in seq(from = -50, to = 50, by = 0.01)) {
  pred <- predict(x, i, b)
  res <- residuals(pred, y)
  ssr <- ssrloss(pred, y)
  ssrs <- append(ssrs, ssr)
  srs <- append(srs, sum(res))
  as <- append(as, i)
}
length(ssrs)
length(srs)
length(as)

min(ssrs)
min.pos.ssrs <- which(ssrs == min(ssrs))
min.pos.ssrs
print(as[min.pos.ssrs])
summary(mo)
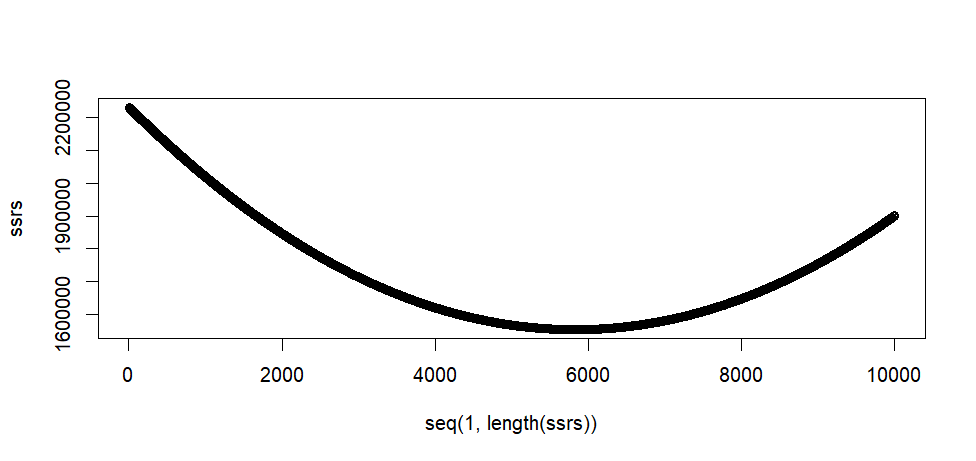
plot(seq(1, length(ssrs)), ssrs)
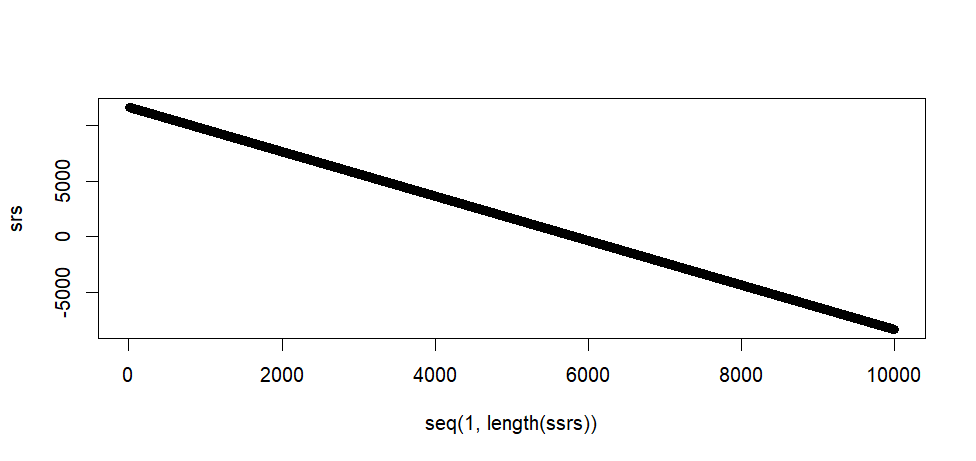
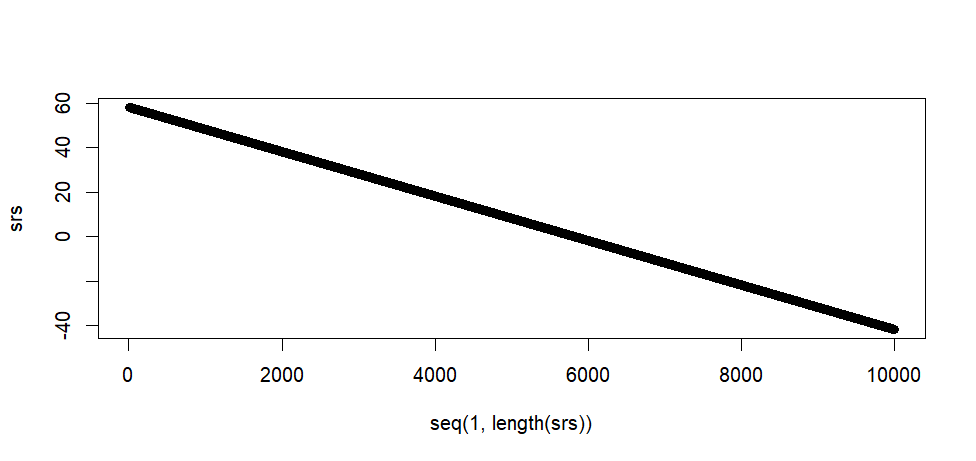
plot(seq(1, length(ssrs)), srs)
tail(ssrs)
max(ssrs)
min(ssrs)
tail(srs)
max(srs)
min(srs)
output
> library(ggplot2)
> library(ggpmisc)
>
> rm(list=ls())
> # set.seed(191)
> nx <- 200
> mx <- 4.5
> sdx <- mx * 0.56
> x <- rnorm(nx, mx, sdx)
> slp <- 12
> y <-  slp * x + rnorm(nx, 0, slp*sdx*3)
>
> data <- data.frame(x, y)
>
> mo <- lm(y ~ x, data = data)
> summary(mo)

Call:
lm(formula = y ~ x, data = data)

Residuals:
     Min       1Q   Median       3Q      Max
-259.314  -59.215    6.683   58.834  309.833

Coefficients:
            Estimate Std. Error t value Pr(>|t|)
(Intercept)    8.266     12.546   0.659    0.511
x             11.888      2.433   4.887 2.11e-06 ***
---
Signif. codes:  0 ‘***’ 0.001 ‘**’ 0.01 ‘*’ 0.05 ‘.’ 0.1 ‘ ’ 1

Residual standard error: 88.57 on 198 degrees of freedom
Multiple R-squared:  0.1076,	Adjusted R-squared:  0.1031
F-statistic: 23.88 on 1 and 198 DF,  p-value: 2.111e-06

>
> ggplot(data = data, aes(x = x, y = y)) +
+   geom_point() +
+   stat_poly_line() +
+   stat_poly_eq(use_label(c("eq", "R2"))) +
+   theme_classic()
> # set.seed(191)
> # Initialize random betas
> # 우선 b를 고정하고 a만
> # 변화시켜서 이해
> b <- summary(mo)$coefficients[2]
> a <- 0
>
> b.init <- b
> a.init <- a
>
> # Predict function:
> predict <- function(x, a, b){
+   return (a + b * x)
+ }
>
> # And loss function is:
> residuals <- function(predictions, y) {
+   return(y - predictions)
+ }
>
> # we use sum of square of error which oftentimes become big
> ssrloss <- function(predictions, y) {
+   residuals <- (y - predictions)
+   return(sum(residuals^2))
+ }
>
> ssrs <- c() # for sum  of square residuals
> srs <- c() # sum of residuals
> as <- c() # for as (intercepts)
>
> for (i in seq(from = -50, to = 50, by = 0.01)) {
+   pred <- predict(x, i, b)
+   res <- residuals(pred, y)
+   ssr <- ssrloss(pred, y)
+   ssrs <- append(ssrs, ssr)
+   srs <- append(srs, sum(res))
+   as <- append(as, i)
+ }
> length(ssrs)
[1] 10001
> length(srs)
[1] 10001
> length(as)
[1] 10001
>
> min(ssrs)
[1] 1553336
> min.pos.ssrs <- which(ssrs == min(ssrs))
> min.pos.ssrs
[1] 5828
> print(as[min.pos.ssrs])
[1] 8.27
> summary(mo)

Call:
lm(formula = y ~ x, data = data)

Residuals:
     Min       1Q   Median       3Q      Max
-259.314  -59.215    6.683   58.834  309.833

Coefficients:
            Estimate Std. Error t value Pr(>|t|)
(Intercept)    8.266     12.546   0.659    0.511
x             11.888      2.433   4.887 2.11e-06 ***
---
Signif. codes:  0 ‘***’ 0.001 ‘**’ 0.01 ‘*’ 0.05 ‘.’ 0.1 ‘ ’ 1

Residual standard error: 88.57 on 198 degrees of freedom
Multiple R-squared:  0.1076,	Adjusted R-squared:  0.1031
F-statistic: 23.88 on 1 and 198 DF,  p-value: 2.111e-06

> plot(seq(1, length(ssrs)), ssrs)
> plot(seq(1, length(ssrs)), srs)
> tail(ssrs)
[1] 1900842 1901008 1901175 1901342 1901509 1901676
> max(ssrs)
[1] 2232329
> min(ssrs)
[1] 1553336
> tail(srs)
[1] -8336.735 -8338.735 -8340.735 -8342.735 -8344.735 -8346.735
> max(srs)
[1] 11653.26
> min(srs)
[1] -8346.735
>
>
위 방법은 dumb . . . . .
우선 a의 범위가 어디가 될지 몰라서 -50 에서 50까지로 한것
이 두 지점 사이를 0.01 단위로 증가시킨 값을 a값이라고 할 때의 sse값을 구하여 저장한 것
이렇게 구한 sse 값들 중 최소값일 때의 a값을 regression의 a값으로 추정한 것.
이렇게 해서 구한 값은 summary(mo)에서의 a와 값과 같다.
SSE 대신에 MSE를 쓰기
#####
# with mean square error (mse) instead of sse

b <- summary(mo)$coefficients[2]
a <- 0

# we use sum of square of error which oftentimes become big
msrloss <- function(predictions, y) {
  residuals <- (y - predictions)
  return(mean(residuals^2))
}

msrs <- c() # for sum  of square residuals
srs <- c() # sum of residuals
as <- c() # for as (intercepts)

for (i in seq(from = -50, to = 50, by = 0.01)) {
  pred <- predict(x, i, b)
  res <- residuals(pred, y)
  msr <- msrloss(pred, y)
  msrs <- append(msrs, msr)
  srs <- append(srs, mean(res))
  as <- append(as, i)
}
length(msrs)
length(srs)
length(as)

min(msrs)
min.pos.msrs <- which(msrs == min(msrs))
min.pos.msrs
print(as[min.pos.msrs])
summary(mo)
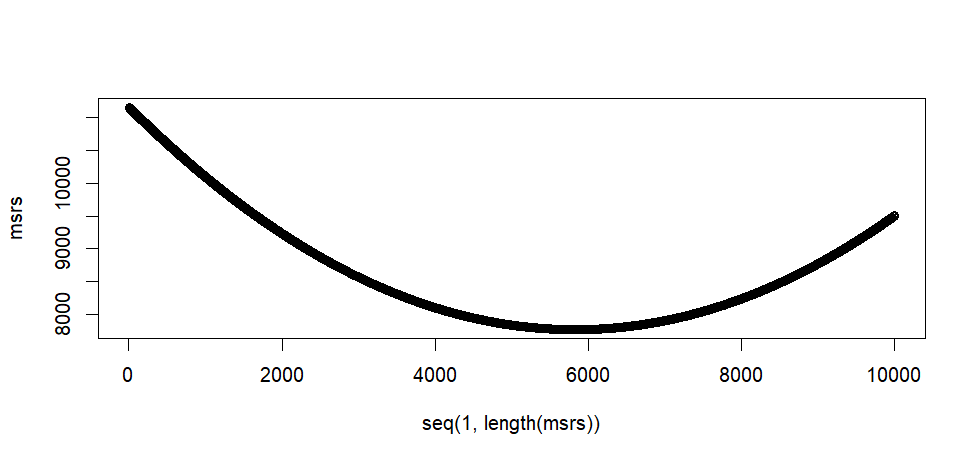
plot(seq(1, length(msrs)), msrs)
plot(seq(1, length(srs)), srs)
tail(msrs)
max(msrs)
min(msrs)
tail(srs)
max(srs)
min(srs)
output
> #####
> # with mean square error (mse) instead of sse
>
> b <- summary(mo)$coefficients[2]
> a <- 0
>
> # we use sum of square of error which oftentimes become big
> msrloss <- function(predictions, y) {
+   residuals <- (y - predictions)
+   return(mean(residuals^2))
+ }
>
> msrs <- c() # for sum  of square residuals
> srs <- c() # sum of residuals
> as <- c() # for as (intercepts)
>
> for (i in seq(from = -50, to = 50, by = 0.01)) {
+   pred <- predict(x, i, b)
+   res <- residuals(pred, y)
+   msr <- msrloss(pred, y)
+   msrs <- append(msrs, msr)
+   srs <- append(srs, mean(res))
+   as <- append(as, i)
+ }
> length(msrs)
[1] 10001
> length(srs)
[1] 10001
> length(as)
[1] 10001
>
> min(msrs)
[1] 7766.679
> min.pos.msrs <- which(msrs == min(msrs))
> min.pos.msrs
[1] 5828
> print(as[min.pos.msrs])
[1] 8.27
> summary(mo)

Call:
lm(formula = y ~ x, data = data)

Residuals:
     Min       1Q   Median       3Q      Max
-259.314  -59.215    6.683   58.834  309.833

Coefficients:
            Estimate Std. Error t value Pr(>|t|)
(Intercept)    8.266     12.546   0.659    0.511
x             11.888      2.433   4.887 2.11e-06 ***
---
Signif. codes:  0 ‘***’ 0.001 ‘**’ 0.01 ‘*’ 0.05 ‘.’ 0.1 ‘ ’ 1

Residual standard error: 88.57 on 198 degrees of freedom
Multiple R-squared:  0.1076,	Adjusted R-squared:  0.1031
F-statistic: 23.88 on 1 and 198 DF,  p-value: 2.111e-06

> plot(seq(1, length(msrs)), msrs)
> plot(seq(1, length(srs)), srs)
> tail(msrs)
[1] 9504.208 9505.041 9505.875 9506.710 9507.544 9508.379
> max(msrs)
[1] 11161.64
> min(msrs)
[1] 7766.679
> tail(srs)
[1] -41.68368 -41.69368 -41.70368 -41.71368 -41.72368 -41.73368
> max(srs)
[1] 58.26632
> min(srs)
[1] -41.73368
>
b값 구하기
이제는 a값을 고정하고 b값도 같은 방식으로 구해볼 수 있다
##############################################
# b값도 범위를 추측한 후에 0.01씩 증가시키면서
# 각 b값에서 mse값을 구해본후 가장 작은 값을
# 가질 때의 b값을 구하면 된다.
# 그러나 b값의 적절한 구간을 예측하는 것이
# 불가능하다 (그냥 추측뿐)
# 위의 y 데이터에서 y = 314*x + rnorm(. . .)
# 이라면 -30-30 구간은 적절하지 않은 구간이 된다.
# 더우기 a값을 정확히 알아야 b값을 추출할 수 있다.
# 이는 적절한 방법이 아니다.

b <- 1
a <- summary(mo)$coefficients[1]

b.init <- b
a.init <- a

# Predict function:
predict <- function(x, a, b){
  return (a + b * x)
}

# And loss function is:
residuals <- function(predictions, y) {
  return(y - predictions)
}

# we use sum of square of error which oftentimes become big
msrloss <- function(predictions, y) {
  residuals <- (y - predictions)
  return(mean(residuals^2))
}

msrs <- c()
mrs <- c()
as <- c()

for (i in seq(from = -50, to = 50, by = 0.01)) {
  pred <- predict(x, a, i)
  res <- residuals(pred, y)
  msr <- msrloss(pred, y)
  msrs <- append(msrs, msr)
  mrs <- append(mrs, mean(res))
  as <- append(as,i)
}

min(msrs)
min.pos.msrs <- which(msrs == min(msrs))
print(as[min.pos.msrs])
summary(mo)
plot(seq(1, length(msrs)), msrs)
plot(seq(1, length(mrs)), mrs)
min(msrs)
max(msrs)
min(mrs)
max(mrs)
output
>
> ##############################################
> # b값도 범위를 추측한 후에 0.01씩 증가시키면서
> # 각 b값에서 mse값을 구해본후 가장 작은 값을
> # 가질 때의 b값을 구하면 된다.
> # 그러나 b값의 적절한 구간을 예측하는 것이
> # 불가능하다 (그냥 추측뿐)
> # 위의 y 데이터에서 y = 314*x + rnorm(. . .)
> # 이라면 -30-30 구간은 적절하지 않은 구간이 된다.
> # 더우기 a값을 정확히 알아야 b값을 추출할 수 있다.
> # 이는 적절한 방법이 아니다.
>
> b <- 1
> a <- summary(mo)$coefficients[1]
>
> b.init <- b
> a.init <- a
>
> # Predict function:
> predict <- function(x, a, b){
+   return (a + b * x)
+ }
>
> # And loss function is:
> residuals <- function(predictions, y) {
+   return(y - predictions)
+ }
>
> # we use sum of square of error which oftentimes become big
> msrloss <- function(predictions, y) {
+   residuals <- (y - predictions)
+   return(mean(residuals^2))
+ }
>
> msrs <- c()
> mrs <- c()
> as <- c()
>
> for (i in seq(from = -50, to = 50, by = 0.01)) {
+   pred <- predict(x, a, i)
+   res <- residuals(pred, y)
+   msr <- msrloss(pred, y)
+   msrs <- append(msrs, msr)
+   mrs <- append(mrs, mean(res))
+   as <- append(as,i)
+ }
>
> min(msrs)
[1] 7766.679
> min.pos.msrs <- which(msrs == min(msrs))
> print(as[min.pos.msrs])
[1] 11.89
> summary(mo)

Call:
lm(formula = y ~ x, data = data)

Residuals:
     Min       1Q   Median       3Q      Max
-259.314  -59.215    6.683   58.834  309.833

Coefficients:
            Estimate Std. Error t value Pr(>|t|)
(Intercept)    8.266     12.546   0.659    0.511
x             11.888      2.433   4.887 2.11e-06 ***
---
Signif. codes:  0 ‘***’ 0.001 ‘**’ 0.01 ‘*’ 0.05 ‘.’ 0.1 ‘ ’ 1

Residual standard error: 88.57 on 198 degrees of freedom
Multiple R-squared:  0.1076,	Adjusted R-squared:  0.1031
F-statistic: 23.88 on 1 and 198 DF,  p-value: 2.111e-06

> plot(seq(1, length(msrs)), msrs)
> plot(seq(1, length(mrs)), mrs)
> min(msrs)
[1] 7766.679
> max(msrs)
[1] 109640
> min(mrs)
[1] -170.3106
> max(mrs)
[1] 276.56
>
a와 b를 동시에 구할 수 있는 방법은 없을까? 위의 방법으로는 어렵다. 일반적으로 우리는 a와 b값이 무엇이되는가를 미분을 이용해서 구할 수 있었다. R에서 미분의 해를 구하기 보다는 해에 접근하도록 하는 프로그래밍을 써서 a와 b의 근사값을 구한다. 이것을 gradient descent라고 부른다.
Gradient descend
위에서 a값이 무엇일 때 mse값이 최소가 될까를 봐서 이 때의 a값을 실제 $y = a + bx$ 의 a 값으로 삼았다. 이 때 a값의 추정을 위해서
seq(-10, 10, 0.01) 의 범위와 증가값을 가지고 일일이 대입하여 mse를 구아였다.
위에서의 0.01씩 증가시켜 대입하는 것이 아니라 처음 한 숫자에서 시작한 후 그 다음 숫자를 정한 후에 점진적으로 그 숫자 간격을 줄여가면서 보면 정율적으로 0.01씩 증가시키는 것 보다 효율적일 것 같다. 이 증가분을 구하기 위해서 미분을 사용한다.
점차하강 = 조금씩 깍아서 원하는 기울기 (미분값) 찾기
prerequisite:
표준편차 추론에서 평균을 사용하는 이유: 실험적_수학적_이해
deriviation of a and b in a simple regression
위의 문서는 a, b에 대한 값을 미분법을 이용해서 직접 구하였다. 컴퓨터로는 이렇게 하기가 쉽지 않다. 그렇다면 이 값을 반복계산을 이용해서 추출하는 방법은 없을까? gradient descent
\begin{eqnarray*}
\text{for a (constant)} \\
\\
\text{SSE} & = & \text{Sum of Square Residuals} \\
\text{Residual} & = & (Y_i - (a + bX_i)) \\
\\
\frac{\text{dSSE}}{\text{da}}
& = & \frac{\text{dResidual^2}}{\text{dResidual}} * \frac{\text{dResidual}}{\text{da}} \\
& = & 2 * \text{Residual} * \dfrac{\text{d}}{\text{da}} (Y_i - (a+bX_i)) \\
& \because & \dfrac{\text{d}}{\text{da}} (Y_i - (a+bX_i)) = -1 \\
& = & 2 * \sum{(Y_i - (a + bX_i))} * -1 \\
& = & -2 *\sum{\text{Residual}} \\
\end{eqnarray*}
아래 R code에서 gradient function을 참조.
\begin{eqnarray*} \text{for b, (coefficient)} \\ \\ \dfrac{\text{d}}{\text{db}} \sum{(Y_i - (a + bX_i))^2} & = & \sum{\dfrac{\text{dResidual}^2}{\text{db}}} \\ & = & \sum{\dfrac{\text{dResidual}^2}{\text{dResidual}}*\dfrac{\text{dResidual}}{\text{db}} } \\ & = & \sum{2*\text{Residual} * \dfrac{\text{dResidual}}{\text{db}} } \\ & = & \sum{2*\text{Residual} * (-X_i) } \;\;\;\; \\ & \because & \dfrac{\text{dResidual}}{\text{db}} = (Y_i - (a+bX_i)) = -X_i \\ & = & -2 X_i \sum{(Y_i - (a + bX_i))} \\ & = & -2 * X_i * \sum{\text{residual}} \\ & .. & -2 * X_i * \frac{\sum{\text{residual}}}{n} \\ & = & -2 * \overline{X_i * \text{residual}} \\ \end{eqnarray*}
위의 설명은 Sum of Square값을 미분하는 것을 전제로 하였지만, Mean Square 값을 (Sum of Square값을 N으로 나눈 것) 대용해서 이해할 수도 있다. 아래의 code는 (미분을 이해한다는 것을 전제로) b값과 a값이 변할 때 msr (mean square residual) 값이 어떻게 변하는가를 알려주는 것이다.
gradient <- function(x, y, predictions){
  error = y - predictions
  db = -2 * mean(x * error)
  da = -2 * mean(error)
  return(list("b" = db, "a" = da))
}
위 펑션으로 얻은 da와 db값을 초기에 설정한 a, b 값에 더해 준 값을 다시 a, b값으로 하여 gradient 펑션을 통해서 다시 db, da값을 구하고 이를 다시 이전 단계에서 구한 a, b값에 더하여 그 값을 다시 a, b값을 하여 . . . .
위를 반복한다. 단, db값과 da값을 그냥 대입하기 보다는 초기에 설정한 learning.rate값을 (0.01 예를 들면) 곱하여 구한 값을 더하게 된다. 이것이 아래의 code이다.
gradient <- function(x, y, predictions){
  error = y - predictions
  db = -2 * mean(x * error)
  da = -2 * mean(error)
  return(list("b" = db, "a" = da))
}

mseloss <- function(predictions, y) {
  residuals <- (y - predictions)
  return(mean(residuals^2))
}

# Train the model with scaled features
learning_rate = 1e-2
lr = 1e-1

# Record Loss for each epoch:
logs = list()
as = c()
bs = c()
mse = c()
sse = c()
x.ori <- x
zx <- (x-mean(x))/sd(x)

nlen <- 50
for (epoch in 1:nlen) {
  predictions <- predict(zx, a, b)
  loss <- mseloss(predictions, y)
  mse <- append(mse, loss)

  grad <- gradient(zx, y, predictions)

  step.b <- grad$b * lr
  step.a <- grad$a * lr
  b <- b-step.b
  a <- a-step.a

  as <- append(as, a)
  bs <- append(bs, b)
}
R code
# the above no gradient
# mse 값으로 계산 rather than sse
# 후자는 값이 너무 커짐

a <- rnorm(1)
b <- rnorm(1)
a.start <- a
b.start <- b

gradient <- function(x, y, predictions){
  error = y - predictions
  db = -2 * mean(x * error)
  da = -2 * mean(error)
  return(list("b" = db, "a" = da))
}

mseloss <- function(predictions, y) {
  residuals <- (y - predictions)
  return(mean(residuals^2))
}

# Train the model with scaled features
learning.rate = 1e-1

# Record Loss for each epoch:
as = c()
bs = c()
mses = c()
sses = c()
mres = c()
zx <- (x-mean(x))/sd(x)

nlen <- 50
for (epoch in 1:nlen) {
  predictions <- predict(zx, a, b)
  residual <- residuals(predictions, y)
  loss <- mseloss(predictions, y)
  mres <- append(mres, mean(residual))
  mses <- append(mses, loss)

  grad <- gradient(zx, y, predictions)

  step.b <- grad$b * learning.rate
  step.a <- grad$a * learning.rate
  b <- b-step.b
  a <- a-step.a

  as <- append(as, a)
  bs <- append(bs, b)
}
mses
mres
as
bs

# scaled
a
b

# unscale coefficients to make them comprehensible
# see http://commres.net/wiki/gradient_descent#why_normalize_scale_or_make_z-score_xi
# and
# http://commres.net/wiki/gradient_descent#how_to_unnormalize_unscale_a_and_b
#
a =  a - (mean(x) / sd(x)) * b
b =  b / sd(x)
a
b

# changes of estimators
as <- as - (mean(x) /sd(x)) * bs
bs <- bs / sd(x)

as
bs
mres
mse.x <- mses

parameters <- data.frame(as, bs, mres, mses)

cat(paste0("Intercept: ", a, "\n", "Slope: ", b, "\n"))
summary(lm(y~x))$coefficients

mses <- data.frame(mses)
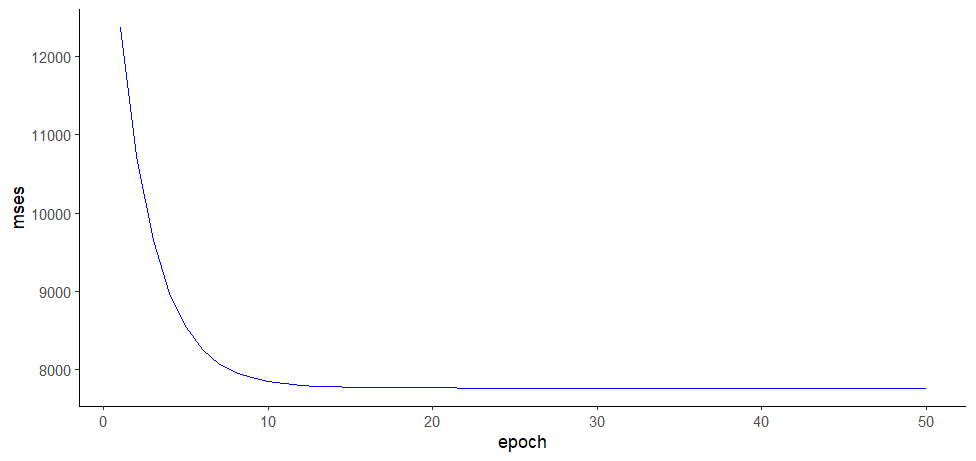
mses.log <- data.table(epoch = 1:nlen, mses)
ggplot(mses.log, aes(epoch, mses)) +
  geom_line(color="blue") +
  theme_classic()

# mres <- data.frame(mres)
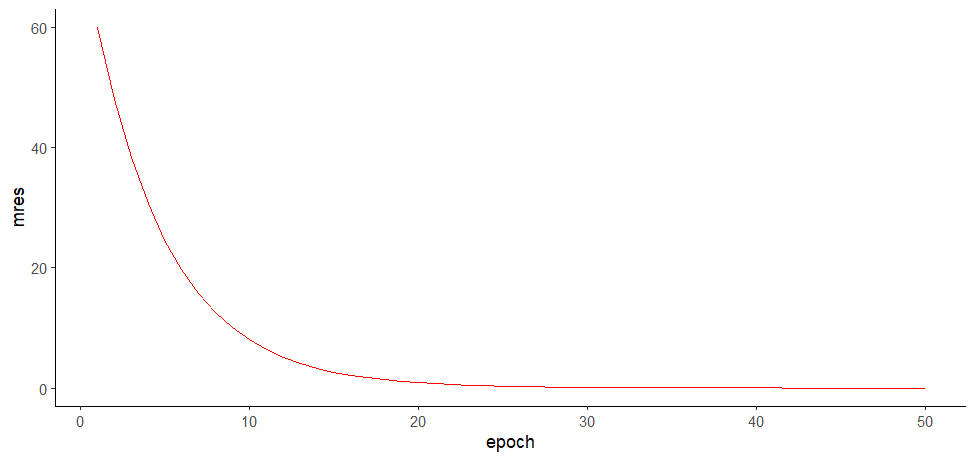
mres.log <- data.table(epoch = 1:nlen, mres)
ggplot(mres.log, aes(epoch, mres)) +
  geom_line(color="red") +
  theme_classic()

ch <- data.frame(mres, mses)
ch
max(y)
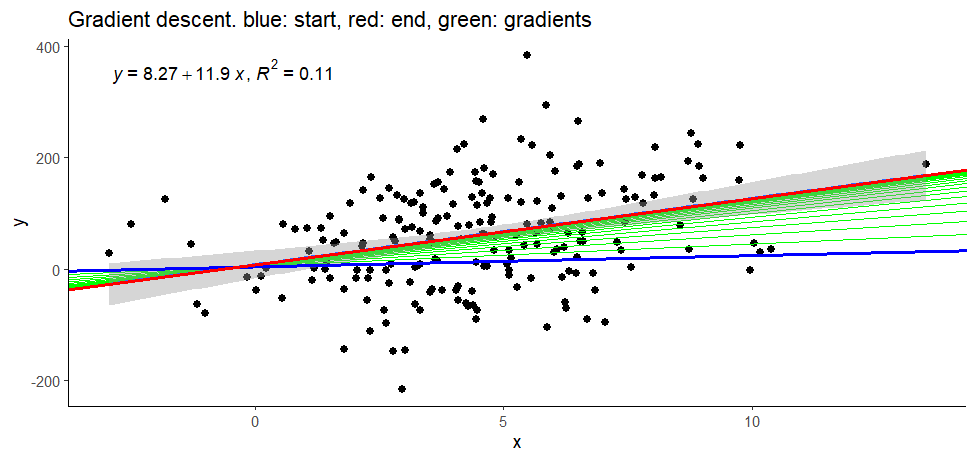
ggplot(data, aes(x = x, y = y)) +
  geom_point(size = 2) +
  geom_abline(aes(intercept = as, slope = bs),
              data = parameters, linewidth = 0.5,
              color = 'green') +
  stat_poly_line() +
  stat_poly_eq(use_label(c("eq", "R2"))) +
  theme_classic() +
  geom_abline(aes(intercept = as, slope = bs),
              data = parameters %>% slice_head(),
              linewidth = 1, color = 'blue') +
  geom_abline(aes(intercept = as, slope = bs),
              data = parameters %>% slice_tail(),
              linewidth = 1, color = 'red') +
  labs(title = 'Gradient descent. blue: start, red: end, green: gradients')
summary(lm(y~x))
a.start
b.start
a
b
R output
>
>
> # the above no gradient
> # mse 값으로 계산 rather than sse
> # 후자는 값이 너무 커짐
>
> a <- rnorm(1)
> b <- rnorm(1)
> a.start <- a
> b.start <- b
>
> gradient <- function(x, y, predictions){
+   error = y - predictions
+   db = -2 * mean(x * error)
+   da = -2 * mean(error)
+   return(list("b" = db, "a" = da))
+ }
>
> mseloss <- function(predictions, y) {
+   residuals <- (y - predictions)
+   return(mean(residuals^2))
+ }
>
> # Train the model with scaled features
> learning.rate = 1e-1
>
> # Record Loss for each epoch:
> as = c()
> bs = c()
> mses = c()
> sses = c()
> mres = c()
> zx <- (x-mean(x))/sd(x)
>
> nlen <- 50
> for (epoch in 1:nlen) {
+   predictions <- predict(zx, a, b)
+   residual <- residuals(predictions, y)
+   loss <- mseloss(predictions, y)
+   mres <- append(mres, mean(residual))
+   mses <- append(mses, loss)
+
+   grad <- gradient(zx, y, predictions)
+
+   step.b <- grad$b * learning.rate
+   step.a <- grad$a * learning.rate
+   b <- b-step.b
+   a <- a-step.a
+
+   as <- append(as, a)
+   bs <- append(bs, b)
+ }
> mses
 [1] 12376.887 10718.824  9657.086  8977.203  8541.840  8263.055  8084.535  7970.219
 [9]  7897.017  7850.141  7820.125  7800.903  7788.595  7780.713  7775.666  7772.434
[17]  7770.364  7769.039  7768.190  7767.646  7767.298  7767.076  7766.933  7766.841
[25]  7766.783  7766.745  7766.721  7766.706  7766.696  7766.690  7766.686  7766.683
[33]  7766.682  7766.681  7766.680  7766.680  7766.679  7766.679  7766.679  7766.679
[41]  7766.679  7766.679  7766.679  7766.679  7766.679  7766.679  7766.679  7766.679
[49]  7766.679  7766.679
> mres
 [1] 60.026423686 48.021138949 38.416911159 30.733528927 24.586823142 19.669458513
 [7] 15.735566811 12.588453449 10.070762759  8.056610207  6.445288166  5.156230533
[13]  4.124984426  3.299987541  2.639990033  2.111992026  1.689593621  1.351674897
[19]  1.081339917  0.865071934  0.692057547  0.553646038  0.442916830  0.354333464
[25]  0.283466771  0.226773417  0.181418734  0.145134987  0.116107990  0.092886392
[31]  0.074309113  0.059447291  0.047557833  0.038046266  0.030437013  0.024349610
[37]  0.019479688  0.015583751  0.012467000  0.009973600  0.007978880  0.006383104
[43]  0.005106483  0.004085187  0.003268149  0.002614519  0.002091616  0.001673292
[49]  0.001338634  0.001070907
> as
 [1] 13.36987 22.97409 30.65748 36.80418 41.72155 45.65544 48.80255 51.32024
 [9] 53.33440 54.94572 56.23478 57.26602 58.09102 58.75102 59.27901 59.70141
[17] 60.03933 60.30967 60.52593 60.69895 60.83736 60.94809 61.03667 61.10754
[25] 61.16423 61.20959 61.24587 61.27490 61.29812 61.31670 61.33156 61.34345
[33] 61.35296 61.36057 61.36666 61.37153 61.37542 61.37854 61.38103 61.38303
[41] 61.38462 61.38590 61.38692 61.38774 61.38839 61.38891 61.38933 61.38967
[49] 61.38993 61.39015
> bs
 [1]  5.201201 10.272237 14.334137 17.587719 20.193838 22.281340 23.953428 25.292771
 [9] 26.365585 27.224909 27.913227 28.464570 28.906196 29.259938 29.543285 29.770247
[17] 29.952043 30.097661 30.214302 30.307731 30.382568 30.442512 30.490527 30.528987
[25] 30.559794 30.584470 30.604236 30.620068 30.632750 30.642908 30.651044 30.657562
[33] 30.662782 30.666964 30.670313 30.672996 30.675145 30.676866 30.678245 30.679349
[41] 30.680234 30.680943 30.681510 30.681965 30.682329 30.682621 30.682854 30.683041
[49] 30.683191 30.683311
>
> # scaled
> a
[1] 61.39015
> b
[1] 30.68331
>
> # unscale coefficients to make them comprehensible
> # see http://commres.net/wiki/gradient_descent#why_normalize_scale_or_make_z-score_xi
> # and
> # http://commres.net/wiki/gradient_descent#how_to_unnormalize_unscale_a_and_b
> #
> a =  a - (mean(x) / sd(x)) * b
> b =  b / sd(x)
> a
[1] 8.266303
> b
[1] 11.88797
>
> # changes of estimators
> as <- as - (mean(x) /sd(x)) * bs
> bs <- bs / sd(x)
>
> as
 [1] 4.364717 5.189158 5.839931 6.353516 6.758752 7.078428 7.330555 7.529361
 [9] 7.686087 7.809611 7.906942 7.983615 8.043999 8.091541 8.128963 8.158410
[17] 8.181574 8.199791 8.214112 8.225367 8.234209 8.241154 8.246605 8.250884
[25] 8.254239 8.256871 8.258933 8.260549 8.261814 8.262804 8.263579 8.264184
[33] 8.264658 8.265027 8.265315 8.265540 8.265716 8.265852 8.265958 8.266041
[41] 8.266105 8.266155 8.266193 8.266223 8.266246 8.266264 8.266278 8.266289
[49] 8.266297 8.266303
> bs
 [1]  2.015158  3.979885  5.553632  6.814203  7.823920  8.632704  9.280539  9.799455
 [9] 10.215107 10.548045 10.814727 11.028340 11.199444 11.336498 11.446279 11.534213
[17] 11.604648 11.661067 11.706258 11.742456 11.771451 11.794676 11.813279 11.828180
[25] 11.840116 11.849676 11.857334 11.863469 11.868382 11.872317 11.875470 11.877995
[33] 11.880018 11.881638 11.882935 11.883975 11.884807 11.885474 11.886009 11.886437
[41] 11.886779 11.887054 11.887274 11.887450 11.887591 11.887704 11.887794 11.887867
[49] 11.887925 11.887972
> mres
 [1] 60.026423686 48.021138949 38.416911159 30.733528927 24.586823142 19.669458513
 [7] 15.735566811 12.588453449 10.070762759  8.056610207  6.445288166  5.156230533
[13]  4.124984426  3.299987541  2.639990033  2.111992026  1.689593621  1.351674897
[19]  1.081339917  0.865071934  0.692057547  0.553646038  0.442916830  0.354333464
[25]  0.283466771  0.226773417  0.181418734  0.145134987  0.116107990  0.092886392
[31]  0.074309113  0.059447291  0.047557833  0.038046266  0.030437013  0.024349610
[37]  0.019479688  0.015583751  0.012467000  0.009973600  0.007978880  0.006383104
[43]  0.005106483  0.004085187  0.003268149  0.002614519  0.002091616  0.001673292
[49]  0.001338634  0.001070907
> mse.x <- mses
>
> parameters <- data.frame(as, bs, mres, mses)
>
> cat(paste0("Intercept: ", a, "\n", "Slope: ", b, "\n"))
Intercept: 8.26630323816515
Slope: 11.8879715830899
> summary(lm(y~x))$coefficients
             Estimate Std. Error   t value     Pr(>|t|)
(Intercept)  8.266323  12.545898 0.6588865 5.107342e-01
x           11.888159   2.432647 4.8869234 2.110569e-06
>
> mses <- data.frame(mses)
> mses.log <- data.table(epoch = 1:nlen, mses)
> ggplot(mses.log, aes(epoch, mses)) +
+   geom_line(color="blue") +
+   theme_classic()
>
> # mres <- data.frame(mres)
> mres.log <- data.table(epoch = 1:nlen, mres)
> ggplot(mres.log, aes(epoch, mres)) +
+   geom_line(color="red") +
+   theme_classic()
>
> ch <- data.frame(mres, mses)
> ch
           mres      mses
1  60.026423686 12376.887
2  48.021138949 10718.824
3  38.416911159  9657.086
4  30.733528927  8977.203
5  24.586823142  8541.840
6  19.669458513  8263.055
7  15.735566811  8084.535
8  12.588453449  7970.219
9  10.070762759  7897.017
10  8.056610207  7850.141
11  6.445288166  7820.125
12  5.156230533  7800.903
13  4.124984426  7788.595
14  3.299987541  7780.713
15  2.639990033  7775.666
16  2.111992026  7772.434
17  1.689593621  7770.364
18  1.351674897  7769.039
19  1.081339917  7768.190
20  0.865071934  7767.646
21  0.692057547  7767.298
22  0.553646038  7767.076
23  0.442916830  7766.933
24  0.354333464  7766.841
25  0.283466771  7766.783
26  0.226773417  7766.745
27  0.181418734  7766.721
28  0.145134987  7766.706
29  0.116107990  7766.696
30  0.092886392  7766.690
31  0.074309113  7766.686
32  0.059447291  7766.683
33  0.047557833  7766.682
34  0.038046266  7766.681
35  0.030437013  7766.680
36  0.024349610  7766.680
37  0.019479688  7766.679
38  0.015583751  7766.679
39  0.012467000  7766.679
40  0.009973600  7766.679
41  0.007978880  7766.679
42  0.006383104  7766.679
43  0.005106483  7766.679
44  0.004085187  7766.679
45  0.003268149  7766.679
46  0.002614519  7766.679
47  0.002091616  7766.679
48  0.001673292  7766.679
49  0.001338634  7766.679
50  0.001070907  7766.679
> max(y)
[1] 383.1671
> ggplot(data, aes(x = x, y = y)) +
+   geom_point(size = 2) +
+   geom_abline(aes(intercept = as, slope = bs),
+               data = parameters, linewidth = 0.5,
+               color = 'green') +
+   stat_poly_line() +
+   stat_poly_eq(use_label(c("eq", "R2"))) +
+   theme_classic() +
+   geom_abline(aes(intercept = as, slope = bs),
+               data = parameters %>% slice_head(),
+               linewidth = 1, color = 'blue') +
+   geom_abline(aes(intercept = as, slope = bs),
+               data = parameters %>% slice_tail(),
+               linewidth = 1, color = 'red') +
+   labs(title = 'Gradient descent. blue: start, red: end, green: gradients')
> summary(lm(y~x))

Call:
lm(formula = y ~ x)

Residuals:
     Min       1Q   Median       3Q      Max
-259.314  -59.215    6.683   58.834  309.833

Coefficients:
            Estimate Std. Error t value Pr(>|t|)
(Intercept)    8.266     12.546   0.659    0.511
x             11.888      2.433   4.887 2.11e-06 ***
---
Signif. codes:  0 ‘***’ 0.001 ‘**’ 0.01 ‘*’ 0.05 ‘.’ 0.1 ‘ ’ 1

Residual standard error: 88.57 on 198 degrees of freedom
Multiple R-squared:  0.1076,	Adjusted R-squared:  0.1031
F-statistic: 23.88 on 1 and 198 DF,  p-value: 2.111e-06

> a.start
[1] 1.364582
> b.start
[1] -1.12968
> a
[1] 8.266303
> b
[1] 11.88797
>
Why normalize (scale or make z-score) xi
x 변인의 측정단위로 인해서 b 값이 결정되게 되는데 이 때의 b값은 상당하고 다양한 범위를 가질 수 있다. 가령 월 수입이 (인컴) X 라고 한다면 우리가 추정해야 (추적해야) 할 b값은 수백만이 될 수도 있다.이 값을 gradient로 추적하게 된다면 너무도 많은 iteration을 거쳐야 할 수 있다. 변인이 바뀌면 이 b의 추적범위도 드라마틱하게 바뀌게 된다. 이를 표준화한 x 점수를 사용하게 된다면 일정한 learning rate와 iteration만으로도 정확한 a와 b를 추적할 수 있게 된다.
How to unnormalize (unscale) a and b
\begin{eqnarray*} y & = & a + b * x \\ & & \text{we use z instead of x} \\ & & \text{and } \\ & & z = \frac{(x - \mu)}{\sigma} \\ & & \text{suppose that the result after calculation be } \\ y & = & k + m * z \\ & = & k + m * \frac{(x - \mu)}{\sigma} \\ & = & k + \frac{m * x}{\sigma} - \frac{m * \mu}{\sigma} \\ & = & k - \frac{m * \mu}{\sigma} + \frac{m * x}{\sigma} \\ & = & \underbrace{k - \frac{\mu}{\sigma} * m}_\text{ 1 } + \underbrace{\frac{m}{\sigma}}_\text{ 2 } * x \\ & & \text{therefore, a and be that we try to get are } \\ a & = & k - \frac{\mu}{\sigma} * m \\ b & = & \frac{m}{\sigma} \\ \end{eqnarray*}
