This is an old revision of the document!
Table of Contents
Using the normal distribution
7장까지는 이산데이터에 (discrete data) 기초한 확률을 살펴보았다. 이산데이터란 정확한 가치에 기초한 것을 말하는 것으로 룰렛에서 이기는 횟수, 성공하는 횟수, 방문하는 횟수, 등등을 말한다. 비록 이는 종류로 측정된 것이 아닌 수치적데이터라고 할 수는 있지만, 연속적인 (continuous) 데이터와는 다른 성격을 갖는다. 끈의 길이나, IQ 점수, 성적(GPA), 등등은 단위적인 측정이 (discrete) 아닌, 정밀한 수치를 조밀하게 등분하여 측정하는 것을 말한다.
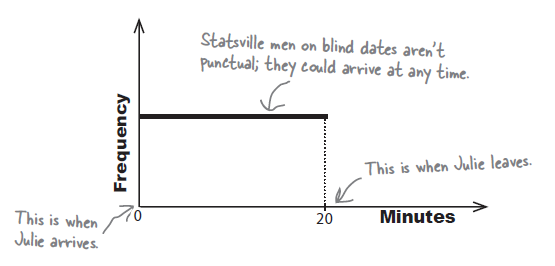
20분 동안만 기다리고 그 직후 떠나버리는 줄리의 상황에서 20분 동안의 시간 중에서 5분이상을 기달릴 확률을 구하는 것은 이산데이터와는 다른 성격을 갖는다. 아래는 베팅에서의 상금을 기초로 각 상황에 (discrete situation) 맞는 확률을 구하여 전체를 파악하는 것이지만, 시간의 경우는 이와 같은 방법을 수행할 수 없다.
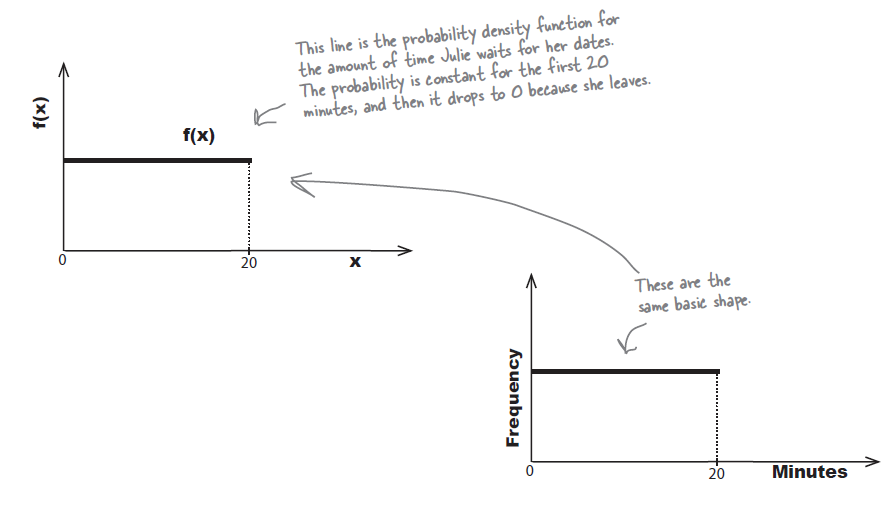
연속적인 데이터에는 확률밀도함수를 (probability density function) 사용할 수 있다.
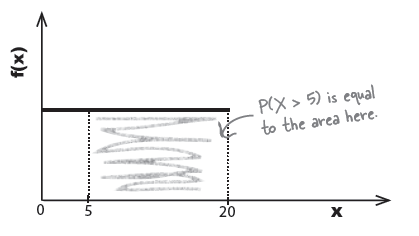
대부분 확률 = 면적과 같이 생각할 수 있다.
총 20 *1 의 면적 중에서 15 * 1의 면적이 P(X > 5)일 때의 확률이다. 이는
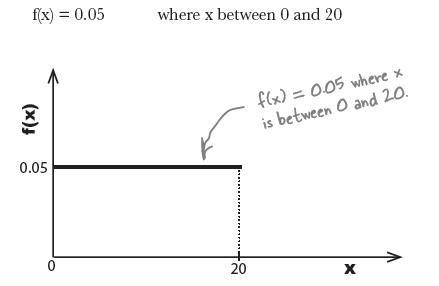
\begin{eqnarray*} 1 & = & 20 * \text{height} \\ \text{height} & = & 1/20 \\ & = & 0.05 \end{eqnarray*}
따라서 전체 면적을 1로 보는 상황에서, 이 경우는 f(x) = 0.05 라는 공식의 함수를 갖는다.
이 경우에 $P(X > 5)$는
\begin{eqnarray*} P(X > 5) & = & (20 - 5) * 0.05 \\ & = & 0.75 \end{eqnarray*}
우리가 면적을 이용하는 이유는 x축의 모든 경우를 discrete하게 (이산적으로) 나타낼 수 없기 때문이다.
exercise
BE the probability density function
A bunch of probability density functions have lost track of their probabilities. Your job is to play like you’re the probability density function and work out the probability between the specified ranges. Draw a sketch if you think that will help.
1. f(x) = 0.05 where 0 < x < 20 Find P(X < 5)
2. f(x) = 1 where 0 < x < 1 Find P(X < 0.5)
3. f(x) = 1 where 0 < x < 1 Find P(X > 2)
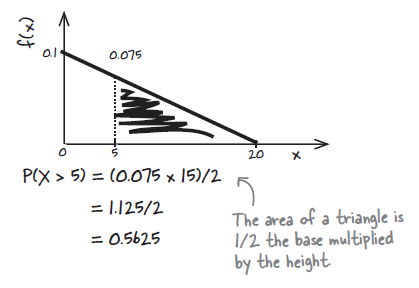
4. f(x) = 0.1 – 0.005x where 0 < x < 20 Find P(X > 5)
Probability density function
연속형 데이터에서는, probability density functions 을 사용한다.
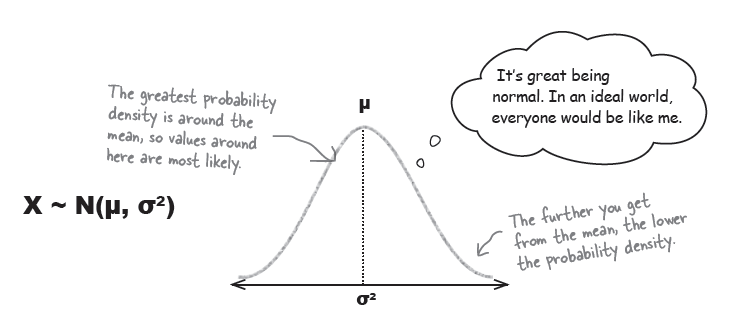
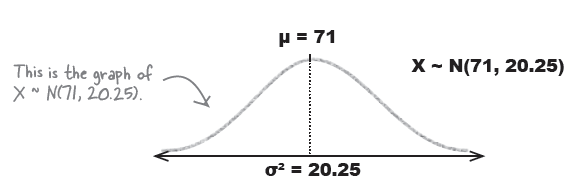
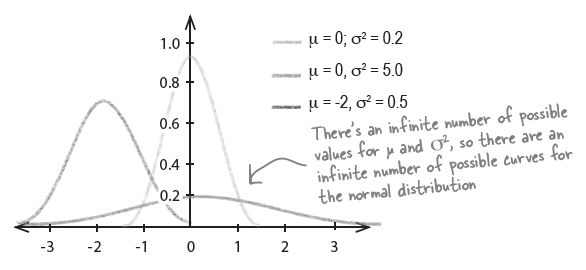
“키”와 같은 데이터 전체는 아래와 같은 분포곡선을 이용하여 표현한다.
주의: $X \sim N(\mu, \sigma^{2})$ 처럼 표현.
\begin{eqnarray*}
\mu$ & = & \text{mean}
\sigma^{2} & = & \text{variance}
\sqrt{\sigma^{2}} & = & \sigma
& = & \text{standard deviation}
\end{eqnarray*}
No matter how far you go out on the graph, the probability density never equals 0.
So how do we find normal probabilities?
e.g.,
$X \sim N(71, 20.25)$
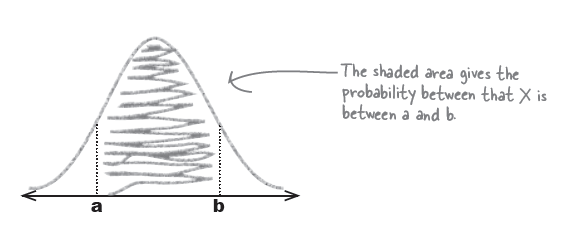
Julie's height = 64 inches 이므로, 아래의 면적에서 빗금친 부분을 구하면 된다.
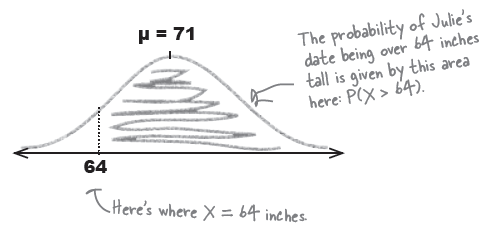
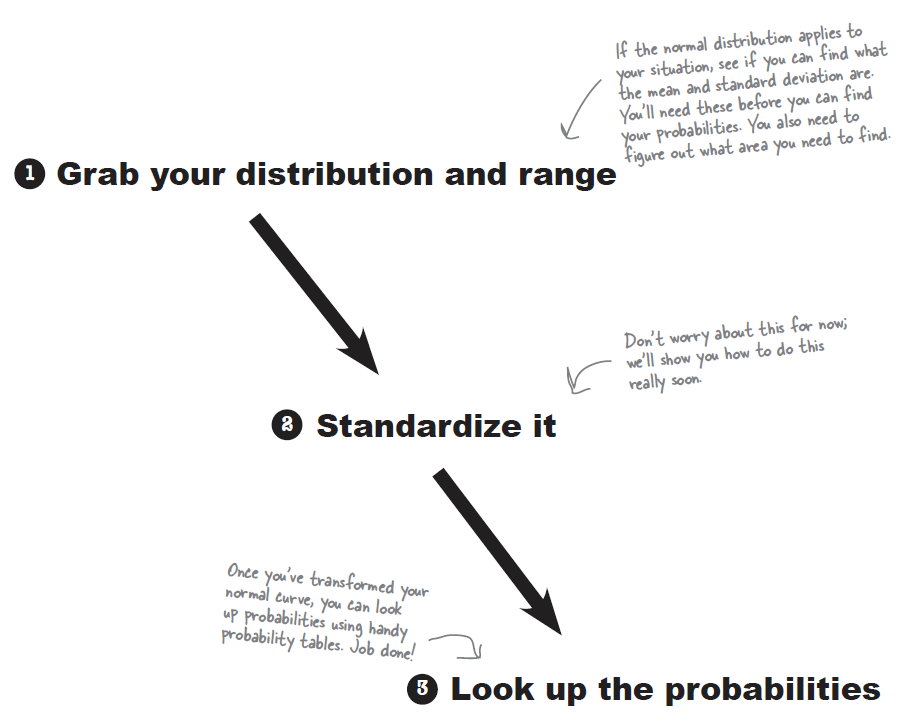
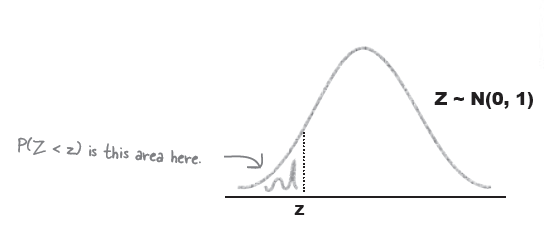
결론적으로, 이 면적을 알기 위해서 64 인치보다 큰 면적을 계산해 준 테이블을 참조하게 되는데, 이 방법의 단점은 모든 평균과 표준편차를 고려한 면적을 제시해 줄 수 있는 표를 만들어 둘 수는 없다. 따라서, Z ~ N(0, 1) 의 표만을 제시하고, 모든 데이터는 Z (표준화) 하여 살펴본다 (아래 그림 참조)
To standardize, first move the mean…
…then squash the width
그래프를 표준편차가 1이 되도록 찌부러뜨린다 (squash).
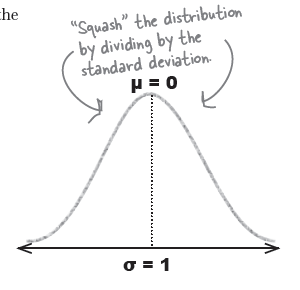
이를 위해서
\begin{eqnarray*} \displaystyle\frac {X - 71} {\sqrt(20.25)} & \sim & N(0, 1) \\ \displaystyle\frac {X - 71} {4.5} & \sim & N(0, 1) \end{eqnarray*}
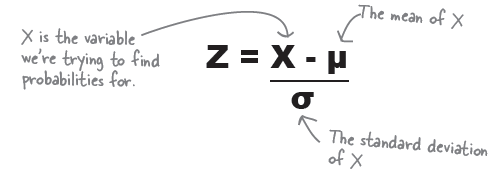
이를 일반화하면
따라서, 이 데이터를 같이 변환하여 z 점수를 찾기 위해서는 (표준점수를 찾기 위해서는)

\begin{eqnarray*} z & = & \displaystyle \frac {x - \mu}{\sigma} \\ & = & \frac {64-71} {4.5} \\ & = & 1.56 \end{eqnarray*}
따라서, 표준점수를 1.56을 가지고 표준점수 테이블에서 1.56보다 큰 부분의 면적을 구한것을 참조하면 된다.
> a <- c(1:100)
> scale(a)
              [,1]
  [1,] -1.70622042
  [2,] -1.67175132
  [3,] -1.63728222
  [4,] -1.60281312
  [5,] -1.56834402
  [6,] -1.53387492
  [7,] -1.49940582
  [8,] -1.46493672
  [9,] -1.43046762
 [10,] -1.39599852
 [11,] -1.36152943
 [12,] -1.32706033
 [13,] -1.29259123
 [14,] -1.25812213
 [15,] -1.22365303
 [16,] -1.18918393
 [17,] -1.15471483
 [18,] -1.12024573
 [19,] -1.08577663
 [20,] -1.05130753
 [21,] -1.01683843
 [22,] -0.98236933
 [23,] -0.94790023
 [24,] -0.91343113
 [25,] -0.87896203
 [26,] -0.84449293
 [27,] -0.81002384
 [28,] -0.77555474
 [29,] -0.74108564
 [30,] -0.70661654
 [31,] -0.67214744
 [32,] -0.63767834
 [33,] -0.60320924
 [34,] -0.56874014
 [35,] -0.53427104
 [36,] -0.49980194
 [37,] -0.46533284
 [38,] -0.43086374
 [39,] -0.39639464
 [40,] -0.36192554
 [41,] -0.32745644
 [42,] -0.29298734
 [43,] -0.25851825
 [44,] -0.22404915
 [45,] -0.18958005
 [46,] -0.15511095
 [47,] -0.12064185
 [48,] -0.08617275
 [49,] -0.05170365
 [50,] -0.01723455
 [51,]  0.01723455
 [52,]  0.05170365
 [53,]  0.08617275
 [54,]  0.12064185
 [55,]  0.15511095
 [56,]  0.18958005
 [57,]  0.22404915
 [58,]  0.25851825
 [59,]  0.29298734
 [60,]  0.32745644
 [61,]  0.36192554
 [62,]  0.39639464
 [63,]  0.43086374
 [64,]  0.46533284
 [65,]  0.49980194
 [66,]  0.53427104
 [67,]  0.56874014
 [68,]  0.60320924
 [69,]  0.63767834
 [70,]  0.67214744
 [71,]  0.70661654
 [72,]  0.74108564
 [73,]  0.77555474
 [74,]  0.81002384
 [75,]  0.84449293
 [76,]  0.87896203
 [77,]  0.91343113
 [78,]  0.94790023
 [79,]  0.98236933
 [80,]  1.01683843
 [81,]  1.05130753
 [82,]  1.08577663
 [83,]  1.12024573
 [84,]  1.15471483
 [85,]  1.18918393
 [86,]  1.22365303
 [87,]  1.25812213
 [88,]  1.29259123
 [89,]  1.32706033
 [90,]  1.36152943
 [91,]  1.39599852
 [92,]  1.43046762
 [93,]  1.46493672
 [94,]  1.49940582
 [95,]  1.53387492
 [96,]  1.56834402
 [97,]  1.60281312
 [98,]  1.63728222
 [99,]  1.67175132
[100,]  1.70622042
attr(,"scaled:center")
[1] 50.5
attr(,"scaled:scale")
[1] 29.01149
> aa <- scale(a)
> mean(aa)
[1] 0
> sd(aa)
[1] 1
>
exercise
1. N(10, 4), value 6
2. N(6.3, 9), value 0.3
3. N(2, 4). If the standard score is 0.5, what’s the value?
4. The standard score of value 20 is 2. If the variance is 16, what’s the mean?
Step 3: Look up the probability in your handy table
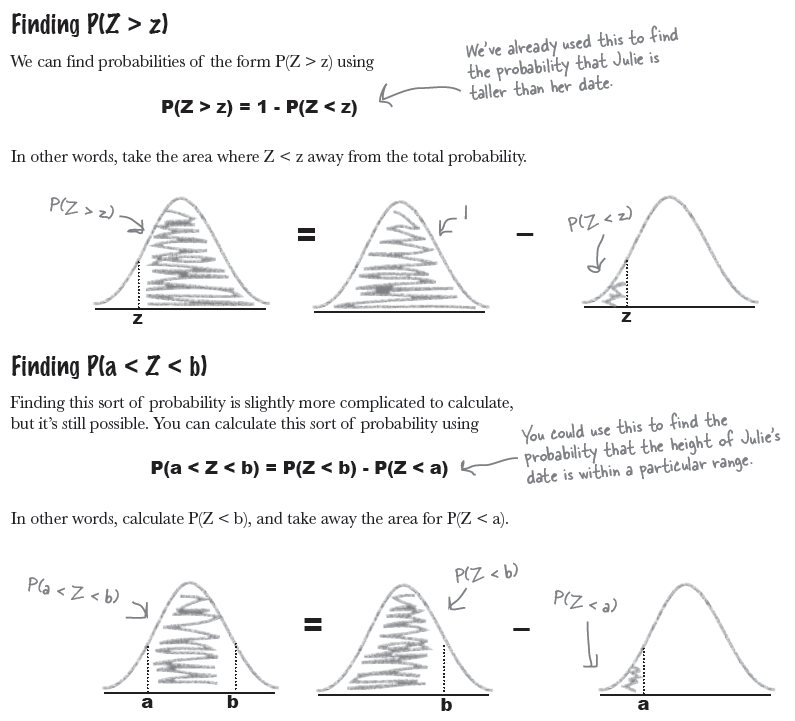
해당 값은 (value) z 점수까지의 부분면적을 의미하므로, P(X > 1.56) 부분은 1에서 이 점수를 뺀 후에 구한다.
\begin{eqnarray*} P(Z > -1.56) & = & 1 - P(Z < -1.56) \\ & = & 1 - 0.0594 \\ & = & 0.9406 \end{eqnarray*}
That is, the probability that Julie’s date is taller than her is 0.9406.
> pnorm(0)
[1] 0.5
> pnorm(-1)
[1] 0.1586553
> pnorm(-1.56)
[1] 0.05937994
> 1- pnorm(-1.56)
> 1- pnorm(-1.56)
[1] 0.9406201
Exercise
Julie with 5“ heels = 64 + 5 = 69
z score = -0.44
\begin{eqnarray*} P(Z > -0.44) & = & 1 - P(Z < -0.44) \\ & = & 1 - 0.3300 \\ & = & 0.67 \end{eqnarray*}
> 1-pnorm(-0.44)
[1] 0.6700314
>
Headline
The Case of the Missing Parameters
Will at Manic Mango Games has a problem. He needs to give his boss the mean and standard deviation of the number of minutes people take to complete level one of their new game. This shouldn’t be difficult, but unfortunately a ferocious terrier has eaten the piece of paper he wrote them on.
Will only has three clues to help him.
- First of all, Will knows that the number of minutes people spend playing level one follows a normal distribution.
- Secondly, he knows that the probability of a player playing for less than 5 minutes is 0.0045.
- Finally, the probability of someone taking less than 15 minutes to complete level one is 0.9641.
How can Will find the mean and standard deviation?
조건 2에서, P(X < 5) = 0.0045 이므로, 이에 해당하는 z 점수는 -2.61.
조건 3에서는, P(X < 15) = 0.9641이므로, 이에 해당하는 z 점수는 1.8
> qnorm(0.0045)
[1] -2.612054
> qnorm(0.9641)
[1] 1.800384
\begin{eqnarray*} -2.61 & = & \frac {5-\mu}{\sigma} \\ 1.8 & = & \frac {15-\mu}{\sigma} \end{eqnarray*}
이를 풀어보면
\begin{eqnarray*}
\mu & = & 10.914 \\
\sigma & = & 2.27
\end{eqnarray*}

