Table of Contents
See anova, repeated measure anova
Factorial ANOVA
t-test와 ANOVA의 섹션까지 다룬것은 모두 하나의 독립변인(Independent Variable)과 하나의 종속변인(Dependent Variable) 간의 관계에 대한 규명을 하는 것이었다.
실제 연구를 하는 경우 이와 같이 하나씩의 독립변인과 종속변인으로 이루어진 검증을 하기보다는 여러가지 다른 원인을 종합적으로 살펴보는 때가 많다. 즉, 연구자는 실험참가자의 행동이나 반응으로 나타나는 종속변인의 원인을 하나의 독립변인이 아닌 여러가지 (대개는 2가지) 독립변인을 놓고 살펴본다는 것이다.
이와 같은 연구를 Factorial Design이라고 한다.
2개의 독립변인과 하나의 종속변인으로 이루어진 디자인이라면 Two-factor design이라고 부를 수 있다.
예
여름에는 작업 능률이 떨어진다고 한다. 덥기 때문이다. 그러나, 종종 사람들은 더운 것은 참을 수 있으나 습도가 높은 것은 참을 수 없다고 한다. 즉, 작업능률을 저하하는데 작용하는 (영향을 미치는) 요소로 2가지가 포함될 수 있다. 하나는 온도이고 하나는 습도이다. 아래 표는 이를 위한 실험에 대한 결과를 표로 요약한 것이다. 표가 의미하는 것은 이 연구가 6개의 특별한 상황 (2가지의 독립변인으로 인해서 일어나는)에 따른 작업능률의 (한가지의 종속변인) 변화에 대한 파악이다.
| Factor B: Temperature | |||||
|---|---|---|---|---|---|
| 24 | 29 | 34 | |||
| Factor A: Humidity | 30% | n=15 24도 30% | n=15 29도 30% | n=15 34도 30% | n30=45 $\overline{X_{30_{\\\%}}} = ? $ |
| 70% | n=15 24도 70% | n=15 29도 70% | n=15 34도 70% | n70=45 $ \overline{X_{70_{\\\%}}} = ? $ |
|
| n24=30 $ \overline{X_{24^{c}}} = ? $ | n29=30 $ \overline{X_{29^{c}}} = ? $ | n34=30 $ \overline{X_{34^{c}}} = ? $ | |||
위의 상황에서 독립변인의 분석을 한다고 하면, 연구자가 관심을 갖고 살펴보게 되는 부분으로
- 습도의 변화 (2가지, 30%와 70%)에 따른 차이
- 온도의 변화 (3가지, 24, 29, 34도)에 따른 차이
- 위의 두 가지 변화로 설명되지 않는다고 나타나는 차이 (만약에 존재한다면) = 즉, 두 가지 독립변인의 동시존재에 의해서만 나타나는 차이
를 보는 것이 된다. 따라서, 가설테스트의 입장에서 보면, 연구자는 한가지 문제에 대한 3가지 가설을 테스트하는 것이 된다. 이를 풀어서 이야기 하자면, 1) 습도의 영향력 2) 온도의 영향력 3) 두가지가 동시존재함으로써 나타나는 영향력 에 대한 테스트이다.
얼뜻 보면, 복잡한듯 하지만, 위의 테스트 또한 F-test ([ANOVA])를 이용하여 해결할 수 있으며, 이는 아래와 같이 나타낼 수 있다.
$$F = \frac{\text{variance (differences) \\ between sample means}}{\text{variance (difference) expected by chance}} \cdots [1]$$
위의 식 [1]이 F값이 크다는 것은 샘플 간의 차이가 랜덤하게 나타나는 차이에 비해 상대적으로 크다는 것을 의미한다. 이 차이가 통계학적으로 유의미한 정도로 크다고 판단하기 위해서는 ANOVA에서 본 것과 같이 F-ratio테이블을 이용하게 된다.
주효과 (Main effects)
| Factor B: Temperature | |||||
|---|---|---|---|---|---|
| Factor A: Humidity | 24 | 29 | 34 | ||
| 30% | $ \overline{X}=85 $ | $ \overline{X}=80 $ | $ \overline{X}=75 $ | $ \overline{X}=80 $ | |
| 70% | $ \overline{X}=75 $ | $ \overline{X}=70 $ | $ \overline{X}=65 $ | $ \overline{X}=70 $ | |
| $ \overline{X}=80 $ | $ \overline{X}=75 $ | $ \overline{X}=70 $ | |||
Factor A: Humidity에 관한 가설은 아래와 같이 정리된다:
$$\text{H1: } \mu_{A_1} \neq \mu_{A_2}$$
이에 대한 영가설은:
$$\text{H1: } \mu_{A_1} = \mu_{A_2}$$
이에 대한 F-test는
$$F = \frac{\text{variance (difference) between the means for the factor A}}{\text{variance (difference) expected by chance}}$$
$$F = \frac{\text{variance (difference) between row means}}{\text{variance (difference) expected by chance}}$$
와 같이 정리할 수 있다.
반면에, Factor B: Temperature에 관한 가설은:
$\text{H1: } \mu_{B_1} \neq \mu_{B_2} $ 혹은
$\text{H1: } \mu_{B_2} \neq \mu_{B_3} $ 혹은
$\text{H1: } \mu_{B_1} \neq \mu_{B_3} $ 혹은
$\text{H1: } \mu_{B_1} \neq \mu_{B_2} \neq \mu_{B_3} $
와 같이 정리될 수 있는데, 한가지 현상에 대한 가설을 여러번에 나누어서 설명하는 것은 복잡하므로 아래와 같이 요약해 볼 수 있다.
H1: 적어도 한 평균값이 다른 평균값과 다를 것이다.
이에 대한 영가설은 비교적 쉽게 표현된다:
$\text{H1: } \mu_{B_1} = \mu_{B_2} = \mu_{B_3}$
다시, 이에 대한 F-test는
$$F = \frac{\text{variance (difference) between the means for the factor B}}{\text{variance (difference) expected by chance}}$$
$$F = \frac{\text{variance (difference) between column means}}{\text{variance (difference) expected by chance}}$$
와 같이 정리할 수 있다.
즉, 연구자는 각 독립변인의 특성에 대한 그룹의 분산 간 차이를 비교하여 봄으로써, 각각의 팩터(독립변인)의 효과를 살펴볼 수 있다. 이를 각각 Factor A에 대한 주효과 (Main effect)와 Factor B에 대한 주효과 (Main effect)라고 이야기 할 수 있다.
상호효과 (Interaction effects)
아래의 테이블은 위의 실험결과를 약간 변형한 것인데, 각각의 독립변인 (팩터)에 대한 평균값은 이전의 테이블과 동일하다.
| Factorial ANOVA | |||||
|---|---|---|---|---|---|
| Factor B: Temperature | |||||
| Factor A: Humidity | 24 | 29 | 34 | ||
| 30% | $ \overline{X}=80 $ | $ \overline{X}=80 $ | $ \overline{X}=80 $ | $ \overline{X}=80 $ | |
| 70% | $ \overline{X}=80 $ | $ \overline{X}=70 $ | $ \overline{X}=60 $ | $ \overline{X}=70 $ | |
| $ \overline{X}=80 $ | $ \overline{X}=75 $ | $ \overline{X}=70 $ | |||
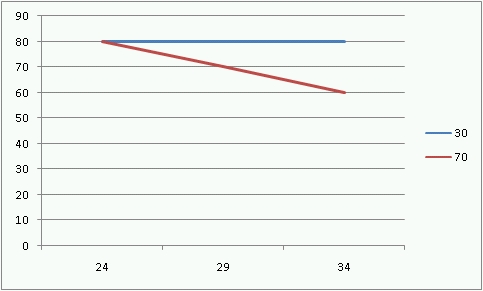
여기서 주의해서 보아야 할 점은 첫번째 열에서의 평균인 80점은 각 셀의 점수인 80점의 평균으로 온도의 차이에 의한 영향력이 없다는 것을 의미한다. 그러나, 두번째 열을 채우는 셀의 값들은 10점씩의 차이를 보이고 있다. 이 차이가 온도에 의한 것이라고 이야기 하자면, 30%의 습도 상태에서는 이 차이가 보이질 않았다는 것이 문제가 된다. 다른 말로 표현하자면, 온도에 의한 차이를 보기 위해서는 습도가 관건이 된다는 것이다. 또 다르게 표현하자면, 온도에 의한 차이가 나타난 것은 습도의 상태와 서로 엮여서만 나타나는 것처럼 보이는 것이다. 이와 같이 차이에 대한 해석에 있어서 오직 한 상태(독립변인)의 영향력으로만 설명할 수 없는 상황을 해석할 때, '상호효과(interaction effect)'가 있다고 이야기 한다. 이를 다시 이야기 하자면, 'B의 효과는 A와 상호의존적인 상태'라고 할 수 있다.
이를 다시 F-test의 공식에 적용시켜서 정리해보면:
$$F = \frac{\text{variance (mean difference) not explained by main effects}}{\text{variance (difference) expected by chance}}$$
와 같다.
이를 가설로 정리를 해보자면
H1: A팩터와 B팩터 간의 상호작용이 존재한다. 즉, 각각의 상태에 따라서 나타나는 평균의 차이가 두 팩터가 갖는 주효과에 의해서만 설명되지 않고 부가적으로 더 있다.
H0: A팩터와 B팩터 간의 상호작용은 존재하지 않는다. 즉, 각각의 상태에 따라서 나타나는 평균의 차이는 두 팩터가 갖는 주효과에 의해서만 설명된다.
와 같이 정리할 수 있다.
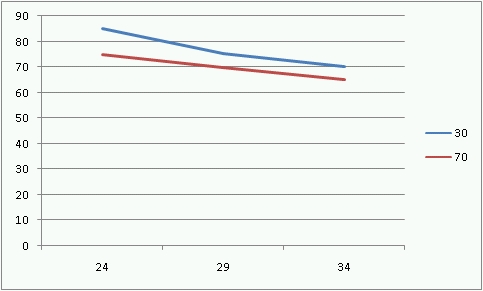
그러나, 사실 위의 표의 해석이 그리 직관적이지는 않다. 상호의존적이라는 단어가 의미하는 것이 그리 직관적이지 않기 때문이다. 이럴 경우, 흔히 연구자는 위의 표를 아래와 같은 도표로 바꾸어 살펴보게 되는데, 이렇게 하는 이유는 상호효과(InteractionEffect)의 존재여부가 완연히 들어나기 때문이다.
그림1과 2의 붉은색선과 푸른색선은 각각 습도의 차이(30%와 70%)를 나타내며 x축은 온도의 차이를 나타낸다. 1의 경우, 두 선은 서로 평행하여 겹치지 않는데 이것이 의미하는 것은 두 요인의 영향력이 서로 독립적으로 나타난다는 뜻이다. 반면에 오른쪽의 그림2는 두선이 평행하지 않는데, 이는 두 요인이 상호의존적으로 작용하기 때문이다. 이 경우에는 온도의 영향은 오직 습도가 높을때에만 나타난다.
e.g.,
| Main effect for factor A but no main effect for factor B | ||||
|---|---|---|---|---|
| B1 | B2 | |||
| A1 | 20 | 20 | MA1 = 20 | 10-point difference |
| A2 | 10 | 10 | MA2 = 10 | |
| MB1 = 15 | MB2 = 15 | |||
| No difference | ||||
| Main effect for both factor A and factor B | ||||
|---|---|---|---|---|
| B1 | B2 | |||
| A1 | 10 | 30 | MA1 = 20 | 10-point difference |
| A2 | 20 | 40 | MA2 = 30 | |
| MB1 = 15 | MB2 = 35 | |||
| 20-point difference | ||||
| No main effect for either factor A and factor B | ||||
|---|---|---|---|---|
| B1 | B2 | |||
| A1 | 10 | 20 | MA1 = 15 | no difference |
| A2 | 20 | 10 | MA2 = 15 | |
| MB1 = 15 | MB2 = 15 | |||
| no difference | ||||
2 Factor ANOVA test
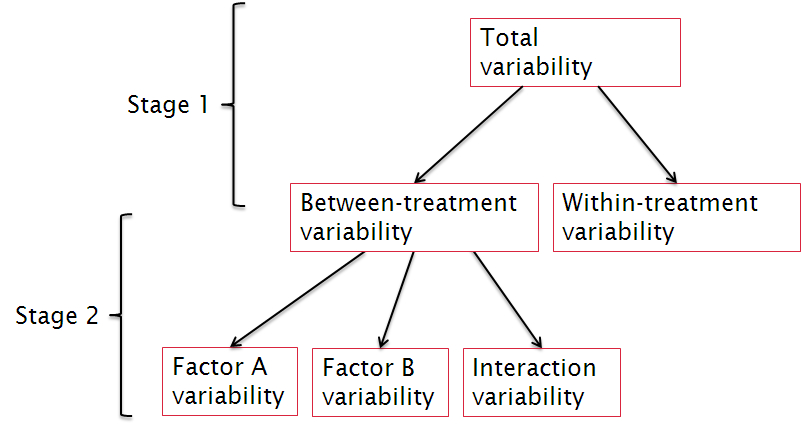
Factorial ANOVA계산은 다음과 같이 쪼개어 볼 수 있다. 우선 첫 단계는 이전의 ANOVA와 같은 단계이다. 즉, Between-variability와 Within-variability를 구해서 그 비율을 보는 것을 말한다. 두번째 단계에서는 각각의 요인(factor)에 대한 variability의 정도와 상호효과(interaction)의 정도를 알아보는 단계이다. 이 단계에서 3가지의 F-비율(F-ratio)을 구한다. 각 요인의 분산정도(variability)를 알기 위해서는 각 요인의 between-treatment 분산정도를 알아야 하고, 또한 within-treatment의 분산정도를 알아야 한다. 언제나 그랬듯이 분산은 다음과 같이 구한다.
$$\text{mean square} = \text{MS} = \frac{SS}{df}$$
실제로 2 Factor F-ratio를 구하는 방법은 단일(single) Factor F-ratio를 구하는 것과 동일하다.
| Factor B | ||||||
|---|---|---|---|---|---|---|
| Factor A | $B_1$ | $B_2$ | $B_3$ | $N=30$ $G=120$ $\Sigma{X^2}=840$ |
||
| $A_1$ | 3 | 2 | 9 | $T_{A_1} = 90$ | ||
| 1 | 5 | 9 | ||||
| 1 | 9 | 13 | ||||
| 6 | 7 | 6 | ||||
| 4 | 7 | 8 | ||||
| T=15 | T=30 | T=45 | ||||
| SS=18 | SS=28 | SS=26 | ||||
| $A_2$ | 0 | 3 | 0 | $T_{A_2} = 30$ | ||
| 2 | 8 | 0 | ||||
| 0 | 3 | 0 | ||||
| 0 | 3 | 5 | ||||
| 3 | 3 | 0 | ||||
| T=5 | T=20 | T=5 | ||||
| SS=8 | SS=20 | SS=20 | ||||
| $T_{B_1}=20$ | $T_{B_2}=50$ | $T_{B_3}=50$ | ||||
Stage 1
Total variability
$$SS_{total}=\Sigma{X^2}-\frac{G^2}{N}$$
\begin{eqnarray} SS_{total} & = & 840-\frac{120^2}{30} \nonumber \\ & = & 840-480 \nonumber \\ & = & 360 \nonumber \end{eqnarray}
$$df_{total}= N - 1$$
$$df_{total}= 29$$
Between variability
$$SS_{\text{between}}=\Sigma{\frac{T^2}{n}}-\frac{G^2}{N}$$
\begin{eqnarray} SS_{\text{between}} & = & { \frac{15^2}{5} + \frac{30^2}{5} + \frac{45^2}{5} + \frac{5^5}{5} + \frac{20^5}{5} + \frac{5^5}{5} - \frac{120^2}{30} } \nonumber \\ & = & 45 + 180 + 405 + 5 + 80 + 5 - 480 \nonumber \\ & = & 720 - 480 \nonumber \\ & = & 240 \nonumber \end{eqnarray}
\begin{eqnarray} df_{between} & = & k - 1 \nonumber \\ & = & \text{number of cells} - 1 \nonumber \\ & = & 5 \nonumber \end{eqnarray}
Within variability
\begin{eqnarray} SS_{within} & = & \Sigma{SS_{each \; treatment}} \nonumber \\ & = & 18 + 28 + 26 + 8 + 20 + 20 \nonumber \\ & = & 120 \nonumber \end{eqnarray}
\begin{eqnarray} df_{within} & = & \Sigma{df_{each \; treatment}} \nonumber \\ & = & 4 + 4 + 4 + 4 + 4 + 4 \nonumber \\ & = & 24 \nonumber \end{eqnarray}
Check
$$SS_{total} = SS_{between} + SS_{within}$$
$$df_{total} = df_{between} + df_{within}$$
Stage 2
1. For factor A.
$$SS_{between \; As} = SS_A = \Sigma{\frac{{T_A}^2}{n_A}} - \frac{G^2}{N}$$
\begin{eqnarray} SS_{A} & = & \frac{90^2}{15} + \frac{30^2}{15} - \frac{120^2}{30} \nonumber \\ & = & 540 + 60 - 480 \nonumber \\ & = & 120 \nonumber \end{eqnarray}
위의 표에서,
$$df=df_{A}=\text{number of levels of A} -1 $$
\begin{eqnarray} df_{\text{between As}} = df_A = \text{(number of levels of As)} - 1 = 1 \nonumber \end{eqnarray}
2. For factor B.
$$SS_{between \; Bs} = SS_B = \Sigma{\frac{{T_B}^2}{n_B}} - \frac{G^2}{N}$$
\begin{eqnarray} SS_{B} & = & \frac{20^2}{10} + \frac{50^2}{10} + \frac{50^2}{10} - \frac{120^2}{30} \nonumber \\ & = & 40 + 250 + 250 - 480 \nonumber \\ & = & 60 \nonumber \end{eqnarray}
$$df=df_{B}=\text{number of levels of B} -1 $$
\begin{eqnarray} df_{\text{between Bs}} = df_B = \text{(number of levels of Bs)} - 1 = 2 \nonumber \end{eqnarray}
3. For interaction (A X B).
$$SS_{A X B} = SS_{between} - SS_A - SS_B $$
\begin{eqnarray} SS_{A X B} & = & 240 - 120 - 60 \nonumber \\ & = & 60 \nonumber \end{eqnarray}
$$df_{A X B} = df_{between} - df_A - df_B $$
$$df_{A X B} = 5 - 1 - 2 = 2 $$
And,
$$MS_{within} = \frac{SS_{within}}{df_{within}}$$
$$MS_{within} = \frac{120}{24} = 5 $$
$$MS_A = \frac{SS_A}{df_A} = \frac{120}{1} $$
$$MS_B = \frac{SS_B}{df_B} = \frac{60}{2} $$
$$MS_{AXB} = \frac{SS_{AXB}}{df_{AXB}} = \frac{60}{2} $$
Finally,
$$ F_A (1, 24) = \frac{MS_A}{MS_{within}} = \frac{120}{5} = 24 $$
$$ F_B (2, 24) = \frac{MS_B}{MS_{within}} = \frac{30}{5} = 6 $$
$$ F_{AXB} (2, 24) = \frac{MS_{AXB}}{MS_{within}} = \frac{30}{5} = 6 $$
Check F distribution table
$$ F_{crit} (1, 24) = 4.26 $$
$$ F_{crit} (2, 24) = 3.40 $$
$$ F_{crit} (2, 24) = 3.40 $$
Check
| Factor B: Temperature | ||||
|---|---|---|---|---|
| Factor A | B1 | B2 | B3 | |
| A1 | n=10 T=0 SS=30 | n=10 T=10 SS=40 | n=10 T=20 SS=50 |
|
| A2 | n=10 T=40 SS=60 | n=10 T=30 SS=50 | n=10 T=20 SS=40 |
|
- Calculate the totals for each level of factor A, and compute SS for factor A.
- Calculate the totals for factor B, and compute SS for the factor
- Given that the between-treatments SS is equal to 100, what is the SS for the interaction?
- Calculate the within-treatments SS, df, and MS for these data.
예 1
detergent.csv
detergent 는 세탁의 정도를 세제의 종류와 물온도를 독립변인으로 (팩터로) 가설검증을 한 것이다. 데이터는 위의 detergent.csv 이다. 또한 손으로 Factorial ANOVA를 하기 위해 이 데이터를 엑셀에 정리하여 detergent.anova.by.hand.xlsx로 올려 두었다.
de <- read.csv("http://commres.net/wiki/_media/detergent.csv", sep = ",", header=T)
de

de$type <- factor(de$type, level=c(1,2), label=c("super", "best"))
de$w.temp <- factor(de$w.temp, level=c(1,2,3), label=c("cold", "warm", "hot"))
de

de.anova <- aov(cleanness ~ type * w.temp, data=de)
summary(de.anova)

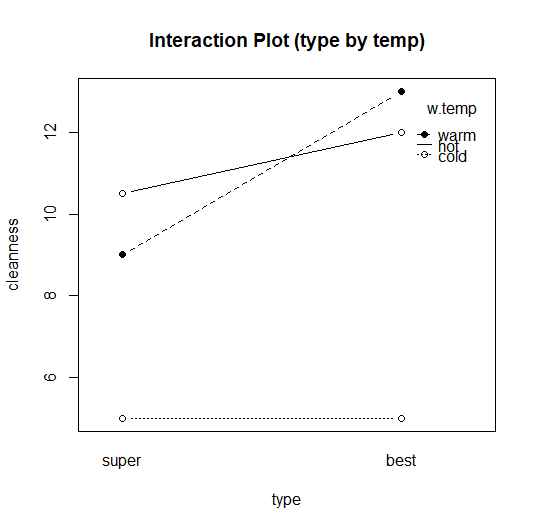
with(de, interaction.plot(x.factor=type,
  trace.factor=w.temp, response=cleanness,
  fun=mean, type="b", legend=T,
  ylab="cleanness", main="Interaction Plot (type by temp)",
  pch=c(1,19)))
> de <- read.csv("http://commres.net/wiki/_media/detergent.csv", sep = ",", header=T)
> de
   type w.temp cleanness
1     1      1         4
2     1      1         5
3     1      1         6
4     1      1         5
5     2      1         6
6     2      1         6
7     2      1         4
8     2      1         4
9     1      2         7
10    1      2         9
11    1      2         8
12    1      2        12
13    2      2        13
14    2      2        15
15    2      2        12
16    2      2        12
17    1      3        10
18    1      3        12
19    1      3        11
20    1      3         9
21    2      3        12
22    2      3        13
23    2      3        10
24    2      3        13
>
> de$type <- factor(de$type, level=c(1,2), label=c("super", "best"))
> de$w.temp <- factor(de$w.temp, level=c(1,2,3), label=c("cold", "warm", "hot"))
> de
    type w.temp cleanness
1  super   cold         4
2  super   cold         5
3  super   cold         6
4  super   cold         5
5   best   cold         6
6   best   cold         6
7   best   cold         4
8   best   cold         4
9  super   warm         7
10 super   warm         9
11 super   warm         8
12 super   warm        12
13  best   warm        13
14  best   warm        15
15  best   warm        12
16  best   warm        12
17 super    hot        10
18 super    hot        12
19 super    hot        11
20 super    hot         9
21  best    hot        12
22  best    hot        13
23  best    hot        10
24  best    hot        13
>
> de.anova <- aov(cleanness ~ type * w.temp, data=de)
> summary(de.anova)
            Df Sum Sq Mean Sq F value   Pr(>F)
type         1  20.17   20.17   9.811  0.00576 **
w.temp       2 200.33  100.17  48.730 5.44e-08 ***
type:w.temp  2  16.33    8.17   3.973  0.03722 *
Residuals   18  37.00    2.06
---
Signif. codes:  0 ‘***’ 0.001 ‘**’ 0.01 ‘*’ 0.05 ‘.’ 0.1 ‘ ’ 1
>
만약에 손으로 계산했다면 R에서
pf(9.810810811, 1, 18, lower.tail=F)
pf(48.72972973, 2, 18, lower.tail=F)
pf(3.972972973, 2, 18, lower.tail=F)
> pf(9.810810811, 1, 18, lower.tail=F)
[1] 0.00575844
> pf(48.72972973, 2, 18, lower.tail=F)
[1] 5.439849e-08
> pf(3.972972973, 2, 18, lower.tail=F)
[1] 0.03722434
>
>
예 2. cookie experiment
- anovadata.sav SPSS 데이터
| Factor B: Fullness | |||||
|---|---|---|---|---|---|
| Factor A: Weight | Empty | Full | |||
| Normal | n=20 $\overline{X}=22$ T=440 SS=1502 | n=20 $\overline{X}$ =15 T=300 SS=940 | $T_\text{obese}=740$ | ||
| Obese | n=20 $\overline{X}$ = 17 T=340 SS=1062 | n=20 $\overline{X}$ = 18 T=360 SS=1084 | $T_\text{normal} = 700$ | ||
| $T_\text{empty} =780$ | $T_\text{full} = 660$ | G=1440 N=80 $\Sigma{X^2}=31028$ |
|||
$SS_{total}=\Sigma{X^2}-\frac{G^2}{N}$
$SS_{\text{between}}=\Sigma{\frac{T^2}{n}}-\frac{G^2}{N}$
$SS_{\text{within}} = \Sigma{SS_{\text{each treatment}}} $
$df_{\text{between}} = k - 1$
$df_{\text{within}} = \Sigma{df_{each \; treatment}} $
$SS_{total} = SS_{between} + SS_{within}$
$df_{total} = df_{between} + df_{within}$
For factor A.
$SS_{between \; As} = SS_A = \Sigma{\frac{{T_A}^2}{n_A}} - \frac{G^2}{N}$
$SS_{between \; Bs} = SS_B = \Sigma{\frac{{T_B}^2}{n_B}} - \frac{G^2}{N}$
$SS_{A X B} = SS_{between} - SS_A - SS_B $
$df=df_{A}=\text{number of levels of A} -1 $
$df=df_{B}=\text{number of levels of B} -1 $
$df_{A X B} = df_{between} - df_A - df_B $
And,
$MS_{within} = \frac{SS_{within}}{df_{within}}$
$MS_A = \frac{SS_A}{df_A} = $
$MS_B = \frac{SS_B}{df_B} = $
$MS_{AXB} = \frac{SS_{AXB}}{df_{AXB}} = $
step 1. Build hypotheses
step 2. Locate the critical range for F-ratio. calculate the $dfs$
- $df_{total}$
- $df_{within}$
- $df_{between}$
- $df_A$
- $df_B$
- $df_{AxB}$
Compute F-ratio
SS
- $SS_{total}$
$\overline{X_{t}}= 18 $
$\overline{X_{t}}^2= 324 $
$N = 80 $
$N*(\overline{X_t}^2) = 25920 $
$\Sigma{X^2} - \frac{(G^2)}{N} = 31028 - 25920 = 5108$
- $SS_{within}$
- $SS_{within} = \Sigma{SS_{within}} = 1502 + 940 + 1062 + 1084 = 4588$
- $SS_{between}$
- $SS_{between} = 5108 - 4588 = 520 $
- $SS_A$
- $SS_B$
- $SS_{\text{AxB}}$
MS
- $MS_{A}$
- $MS_{B}$
- $MS_{\text{AxB}}$
- $MS_{Within}$
F-ratio
- $F_{A}$
- $F_{B}$
- $F_{\text{AxB}}$
Tests of Between-Subjects Effects
Dependent Variable: nCookies
| Source | Type III Sum of Squares | df | Mean Square | F | Sig. |
| Corrected Model | 520.000a | 3 | 173.333 | 2.871 | .042 |
| Intercept | 25920.000 | 1 | 25920.000 | 429.364 | .000 |
| Weight | 20.000 | 1 | 20.000 | .331 | .567 |
| Fullness | 180.000 | 1 | 180.000 | 2.982 | .088 |
| Weight * Fullness | 320.000 | 1 | 320.000 | 5.301 | .024 |
| Error | 4588.000 | 76 | 60.368 | ||
| Total | 31028.000 | 80 | |||
| Corrected Total | 5108.000 | 79 | |||
| a R Squared = .102 (Adjusted R Squared = .066) | |||||
데이터 파일
cookies.csv
손으로 계산하기
cookies.xlsx
cookies <- read.csv("http://commres.net/wiki/_media/cookies.csv")
cookies

str(cookies)

cookies$weight = factor(cookies$weight, levels=c(1,2), labels=c("normal","obese"))
cookies$fullness = factor(cookies$fullness, levels=c(1,2), labels=c("empty","full"))

str(cookies)
cookies

with(cookies, interaction.plot(x.factor=fullness,
  trace.factor=weight, response=ncookies,
  fun=mean, type="b", legend=T,
  ylab="num of cookies", main="Interaction Plot",
  pch=c(1,19)))

cookies.aov <- aov(ncookies ~ weight * fullness, data=cookies)
summary(cookies.aov)
> cookies <- read.csv("http://commres.net/wiki/_media/cookies.csv")
> cookies
   weight fullness ncookies
1       1        1       15
2       1        1       17
3       1        1       32
4       1        1       12
5       1        1       34
6       1        1       27
7       1        1       13
8       1        1       24
9       1        1       41
10      1        1       20
11      1        1       23
12      1        1       25
13      1        1        9
14      1        1       21
15      1        1       22
16      1        1       26
17      1        1       26
18      1        1       28
19      1        1       22
20      1        1        3
21      1        2       22
22      1        2        7
23      1        2       15
24      1        2        6
25      1        2        8
26      1        2       18
27      1        2       24
28      1        2       19
29      1        2       11
30      1        2        9
31      1        2       24
32      1        2       19
33      1        2        9
34      1        2       19
35      1        2       29
36      1        2        9
37      1        2       18
38      1        2       17
39      1        2        3
40      1        2       14
41      2        1        7
42      2        1       19
43      2        1        8
44      2        1       23
45      2        1        6
46      2        1       11
47      2        1       18
48      2        1       23
49      2        1       22
50      2        1       16
51      2        1       28
52      2        1       19
53      2        1        2
54      2        1       27
55      2        1       20
56      2        1       25
57      2        1       23
58      2        1       10
59      2        1       19
60      2        1       14
61      2        2       14
62      2        2       21
63      2        2       16
64      2        2       14
65      2        2       17
66      2        2       20
67      2        2       20
68      2        2       21
69      2        2       32
70      2        2       26
71      2        2        9
72      2        2       14
73      2        2       16
74      2        2       15
75      2        2        6
76      2        2        5
77      2        2       12
78      2        2       23
79      2        2       27
80      2        2       32
>
> str(cookies)
'data.frame':	80 obs. of  3 variables:
 $ weight  : int  1 1 1 1 1 1 1 1 1 1 ...
 $ fullness: int  1 1 1 1 1 1 1 1 1 1 ...
 $ ncookies: int  15 17 32 12 34 27 13 24 41 20 ...
>
> cookies$weight = factor(cookies$weight, levels=c(1,2), labels=c("normal","obese"))
> cookies$fullness = factor(cookies$fullness, levels=c(1,2), labels=c("empty","full"))
>

> str(cookies)
'data.frame':	80 obs. of  3 variables:
 $ weight  : Factor w/ 2 levels "normal","obese": 1 1 1 1 1 1 1 1 1 1 ...
 $ fullness: Factor w/ 2 levels "empty","full": 1 1 1 1 1 1 1 1 1 1 ...
 $ ncookies: int  15 17 32 12 34 27 13 24 41 20 ...
>
> cookies
   weight fullness ncookies
1  normal    empty       15
2  normal    empty       17
3  normal    empty       32
4  normal    empty       12
5  normal    empty       34
6  normal    empty       27
7  normal    empty       13
8  normal    empty       24
9  normal    empty       41
10 normal    empty       20
11 normal    empty       23
12 normal    empty       25
13 normal    empty        9
14 normal    empty       21
15 normal    empty       22
16 normal    empty       26
17 normal    empty       26
18 normal    empty       28
19 normal    empty       22
20 normal    empty        3
21 normal     full       22
22 normal     full        7
23 normal     full       15
24 normal     full        6
25 normal     full        8
26 normal     full       18
27 normal     full       24
28 normal     full       19
29 normal     full       11
30 normal     full        9
31 normal     full       24
32 normal     full       19
33 normal     full        9
34 normal     full       19
35 normal     full       29
36 normal     full        9
37 normal     full       18
38 normal     full       17
39 normal     full        3
40 normal     full       14
41  obese    empty        7
42  obese    empty       19
43  obese    empty        8
44  obese    empty       23
45  obese    empty        6
46  obese    empty       11
47  obese    empty       18
48  obese    empty       23
49  obese    empty       22
50  obese    empty       16
51  obese    empty       28
52  obese    empty       19
53  obese    empty        2
54  obese    empty       27
55  obese    empty       20
56  obese    empty       25
57  obese    empty       23
58  obese    empty       10
59  obese    empty       19
60  obese    empty       14
61  obese     full       14
62  obese     full       21
63  obese     full       16
64  obese     full       14
65  obese     full       17
66  obese     full       20
67  obese     full       20
68  obese     full       21
69  obese     full       32
70  obese     full       26
71  obese     full        9
72  obese     full       14
73  obese     full       16
74  obese     full       15
75  obese     full        6
76  obese     full        5
77  obese     full       12
78  obese     full       23
79  obese     full       27
80  obese     full       32
>

> with(cookies, interaction.plot(x.factor=fullness,
+                                trace.factor=weight, response=ncookies,
+                                fun=mean, type="b", legend=T,
+                                ylab="num of cookies", main="Interaction Plot",
+                                pch=c(1,19)))
>
> cookies.aov <- aov(ncookies ~ weight * fullness, data=cookies)
> summary(cookies.aov)
                Df Sum Sq Mean Sq F value Pr(>F)
weight           1     20    20.0   0.331 0.5666
fullness         1    180   180.0   2.982 0.0883 .
weight:fullness  1    320   320.0   5.301 0.0241 *
Residuals       76   4588    60.4
---
Signif. codes:  0 ‘***’ 0.001 ‘**’ 0.01 ‘*’ 0.05 ‘.’ 0.1 ‘ ’ 1
>
Interpreting interaction
위에서 두개 독립변인에 대한 주효과가 없었으므로 각 독립변인의 종류 (특성) 별로 어디에서 차이가 났는가를 살피는 것은 의미가 없음. 따라서 아래는 필요한 절차가 아님.
> TukeyHSD(cookies.aov, which="weight")
  Tukey multiple comparisons of means
    95% family-wise confidence level

Fit: aov(formula = ncookies ~ weight * fullness, data = cookies)

$weight
    diff       lwr      upr     p adj
2-1   -1 -4.460253 2.460253 0.5665956

> TukeyHSD(cookies.aov, which="fullness")
  Tukey multiple comparisons of means
    95% family-wise confidence level

Fit: aov(formula = ncookies ~ weight * fullness, data = cookies)

$fullness
    diff       lwr       upr    p adj
2-1   -3 -6.460253 0.4602531 0.088274
See also example 5 in Twoway ANOVA in R
e.g.,
| Influence of urine chemicals to other male & female rats | ||||
|---|---|---|---|---|
| Factor B: Amount of chemical | ||||
| None | Small | Large | ||
| Factor A: gender | Male | n=5 T=10 SS=15 | n=5 T=20 SS=19 | n=5 T=30 SS=31 |
| Female | n=5 T=10 SS=15 | n=5 T=20 SS=19 | n=5 T=30 SS=31 |
|
| $\Sigma{X^2} = 460 $ | ||||
Build hypotheses. Use ANOVA with critical level = .05 to test the researcher's hypotheses.


