This is an old revision of the document!
Table of Contents
Constructing Confidence Intervals
Guessing with Confidence
The problem with precision
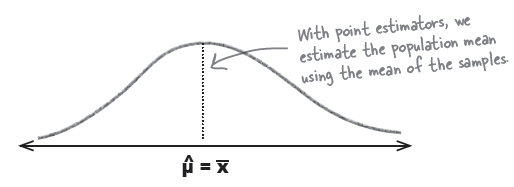
Point estimators are valuable, but they may give slight errors.
Rather than specify an exact value, we can specify two values we expect flavor duration to lie between.
: As an example, you may want to choose a and b so that there’s a 95% chance of the interval containing the population mean. Finding the exact spot of a and b is the problem we are trying to solve.
The far side of each end, (a, b) is called a confidence interval.
Four steps for finding confidence intervals
Step 1: Choose your population statistic
If we go back to the work we did in the last chapter, then the sampling distribution of means has the following expectation and variance:

Step 2: Find its sampling distribution
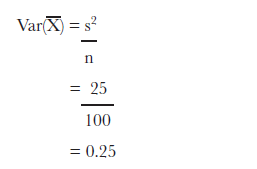
샘플평균들의 분산은 ($Var(\overline{X})$) 모집단의 특성인데 (parameter), 이를 알 수는 없으므로 아래와 같이 샘플의 분산값을 ($s^{2}$) 사용하여 샘플평균들의 분포를 만든다.

위대한 풍선껌은 (Mighty Gumball) 100개의 풍선검을 샘플로 이용하여 단맛의 지속시간을 측정하고, 이 샘플의
- 평균값으로 62.7을
- 분산값으로 (s2) 25를 얻었다.
이를 이용하여 샘플평균들의 (n=100일 때) 분포의 (distribution) 분산값을 예측해보면 0.25를 얻는다.
위를 일반화해서 생각해보면 $X \sim N(\mu, \sigma^{2})$이라고 할 때, 샘플의 숫자가 충분히 크다고 할 때 (n=100과 같이), $E(\overline{X})$ 값과 $Var(\overline{X})$ 값은 아래와 같다.

Step 3: Decide on the level of confidence
Confidence interval, 즉 a 지점과 b 지점사이의 구간을 0.95로 하기로 한다 (일반관행).
Step 4: Find the confidence limits
위에서 얻은 $\overline{X} \sim N(\mu, 0.25)$를 가정하고 아래의 a, b 구간을 95%라고 하면, 양 쪽 끝은 각각, 0.025 씩이 될 것이다.
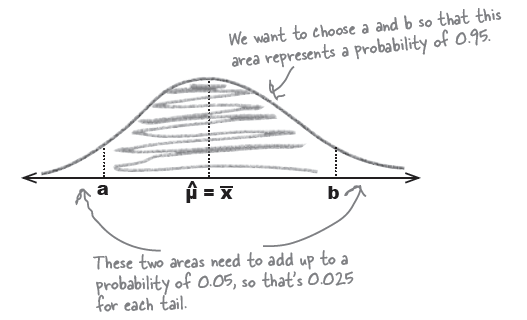
즉, 우리는 $P(\overline{X} < a) = 0.025$ 에서의 a와, $P(\overline{X} > b) = 0.025$에서의 b를 구해서 이를 confidence limits의 경계값으로 삼으면 된다. 그런데 위의 그림과 같은 분포에서의 2.5%에 해당하는 부분을 직접 찾을 수는 없으므로 (r과 같은 프로그램이 없다고 가정), 표준점수를 기준으로 생각하여 z-table에서의 2.5%에 해당하는 z 점수를 찾아야 한다.

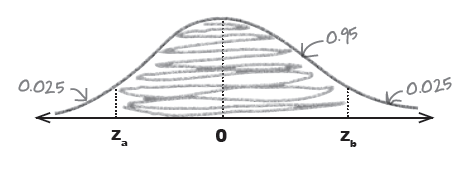
$$P(z_{a} < Z < z_{b}) = 0.95$$
$$P(Z < z_{a}) = 0.025$$
$$z_{a} = -1.96$$
$$P(Z > z_{b}) = 0.025$$
$$z_{b} = +1.96$$
\begin{eqnarray*} P\left(-1.96 < z < 1.96 \right) = 0.95 \\ P\left(-1.96 < \frac{\overline{X}-\mu}{0.5} < 1.96 \right) = 0.95 \end{eqnarray*}
\begin{eqnarray*} -1.96 < \frac{\overline{X}-\mu}{0.5} < 1.96 \\ \end{eqnarray*}
\begin{eqnarray} -1.96 & < & \frac{\overline{X}-\mu}{0.5} \nonumber \\ -1.96 * 0.5 & < & \overline{X}-\mu \nonumber \\ -0.98 + \mu & < & \overline{X} \nonumber \\ \mu & < & \overline{X} + 0.98 \\ \nonumber \\ \nonumber \\ \frac{\overline{X}-\mu}{0.5} & < & 1.96 \nonumber \\ \overline{X}-\mu & < & 1.96 * 0.5 \nonumber \\ \overline{X} & < & 0.98 + \mu \nonumber \\ \overline{X} - 0.98 & < & \mu \end{eqnarray}
(1)과 (2)에서
\begin{eqnarray*}
\;\;\; \overline{X} - 0.98 < \mu < \overline{X} + 0.98
\end{eqnarray*}
\begin{eqnarray*}
P(\overline{X} - 0.98 < \mu < \overline{X} + 0.98) = 0.95
\end{eqnarray*}
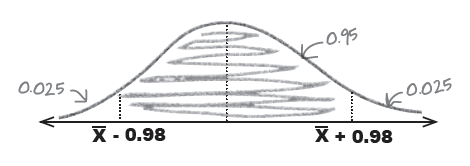
$\overline{X} = 62.7$ 이었으므로 $62.7 - 0.98$와 $62.7 + 0.98$이 구하는 공간 (interval). 즉,
$(61.72, 63.68)$
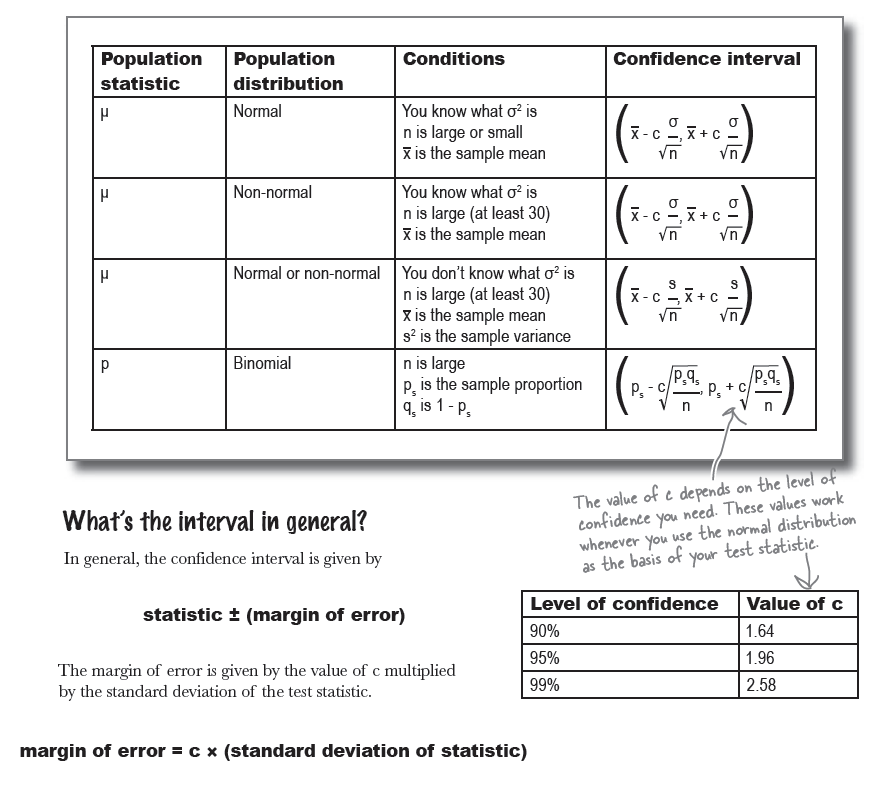
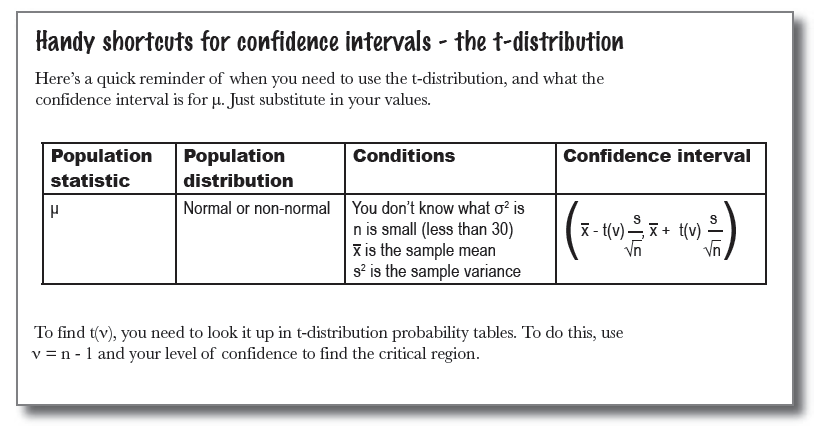
Handy shortcuts for confidence intervals
Mighty Gumball took a sample of 50 gumballs and found that in the sample, the proportion of red gumballs is 0.25. Construct a 99% confidence interval for the proportion of red gumballs in the population.
$$\left(p_{s} - c \sqrt{\frac{p_{s}*q_{s}}{n}}, \quad p_{s} + c \sqrt{\frac{p_{s}*q_{s}}{n}}\right)$$
\begin{eqnarray*} c & = & 2.58 \\ p_{s} & = & 0.25 \\ q_{s} & = & 0.75 \\ n & = & 50 \end{eqnarray*}
\begin{eqnarray*} \text{CI} & = & \left(p_{s} - c \sqrt{\frac{p_{s}*q_{s}}{n}}, \quad p_{s} + c \sqrt{\frac{p_{s}*q_{s}}{n}}\right) \\ & = & \left(0.25 - 2.58*\sqrt{\frac{0.25 * 0.75}{50}}, \quad 0.25 + 2.58*\sqrt{\frac{0.25 * 0.75}{50}} \right) \\ & = & (0.25 - 2.58 * 0.0612, \; 0.25 + 2.58 * 0.0612) \\ & = & (0.25 - 0.158, \; 0.25 + 0.158) \\ & = & (0.092, \; 0.408) \end{eqnarray*}
Just one more problem...
Step 1: Choose your population statistic
Mighty Gumball has taken a representative sample of 10 gumballs and weighed each one. In their sample, x = 0.5 oz and s2 = 0.09.
Step 2: Find its sampling distribution
The normal distribution isn't a good approximation for every situation.
When sample sizes are large, the normal distribution is ideal for finding confidence intervals. It gives accurate results, irrespective of how the population itself is distributed.
Here we have a different situation. Even though $X$ itself is distributed normally, $\overline{X}$ isn’t.
Because of small number of sample . . . .
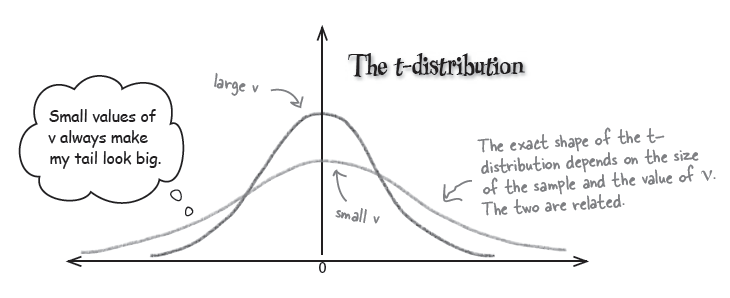
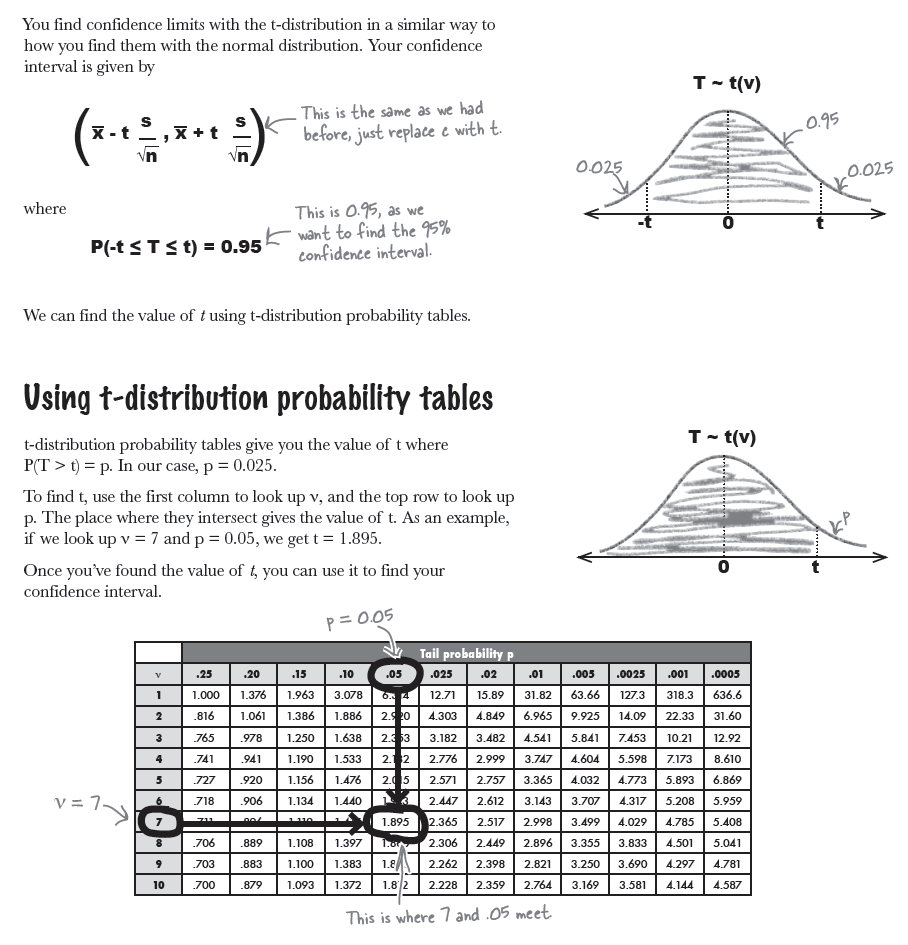
So what sort of distribution does X follow? It actually follows a t-distribution.

