c:ms:regression_lecture_note_for_r
Table of Contents
Code
You need to install some packages
install.packages("lm.beta")
install.packages("ppcor")
install.packages("ggplot2")
################
rnorm2 <- function(n,mean,sd) { mean+sd*scale(rnorm(n)) }
n <- 16

set.seed(101)
x <- rnorm2(n, 265, 15)
rand.00 <- rnorm2(n, 0, 12)

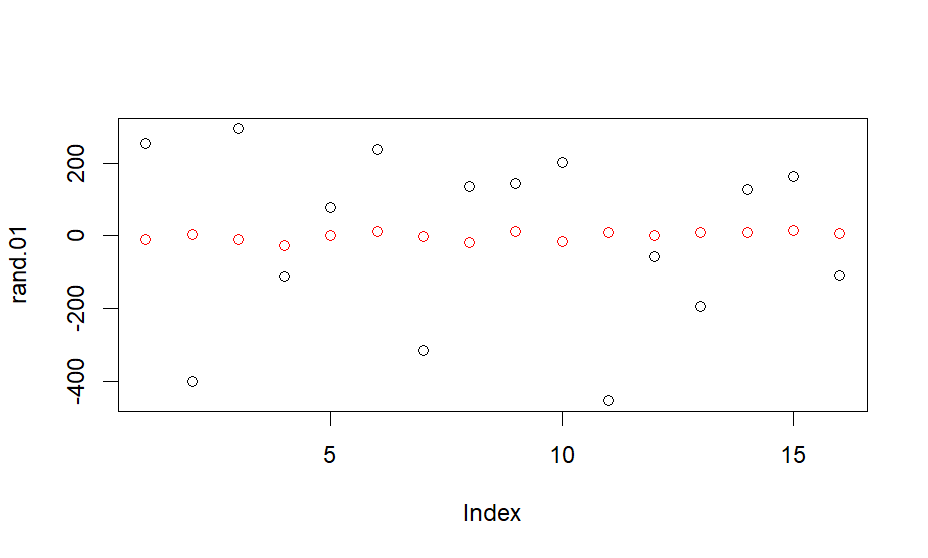
rand.01 <- rnorm2(n, 0, 240)
plot(rand.01)
points(rand.00, col="red")

b <- 170 / 265
b <- round(b,1)
b
y <- b * x + rand.00

df <- data.frame(x, y)
head(df)

# plot method 0
plot(x,y)

# method 1
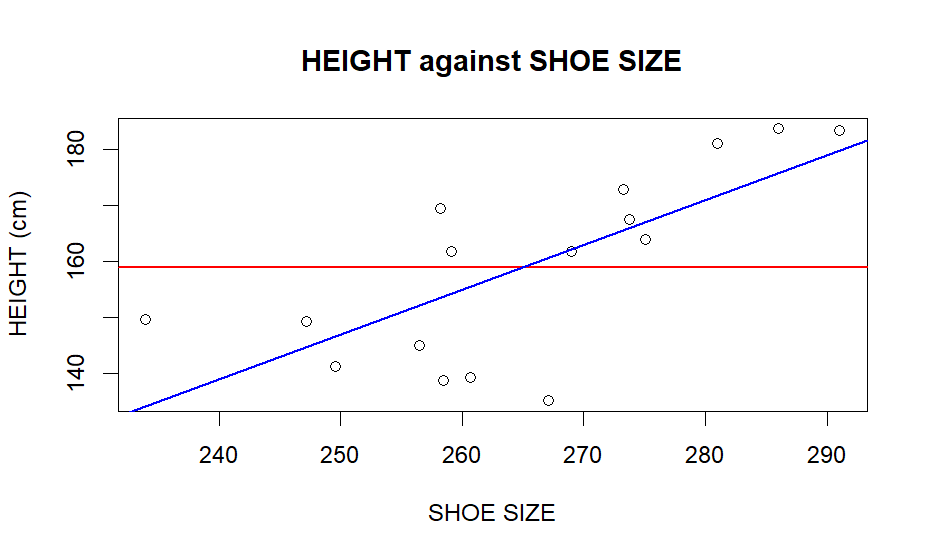
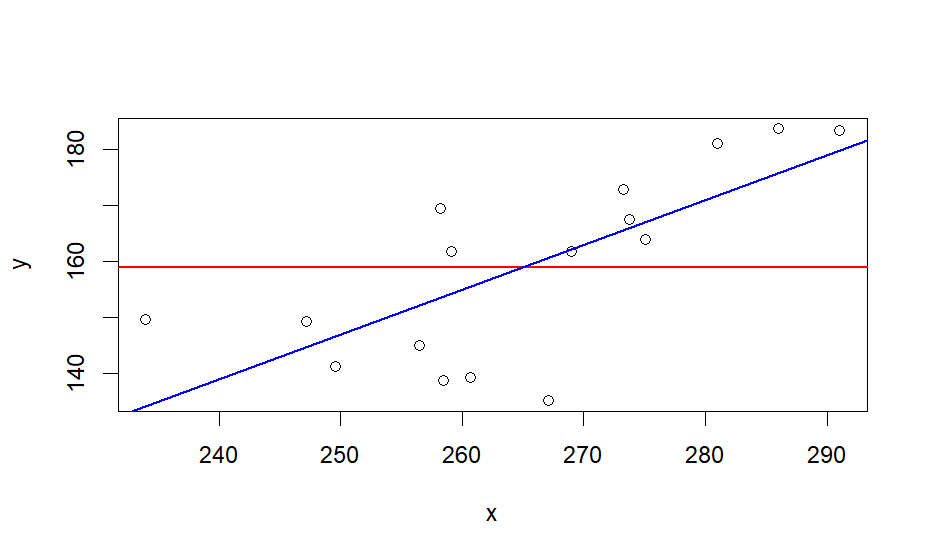
plot(x, y, pch = 1, cex = 1, col = "black", main = "HEIGHT against SHOE SIZE", xlab = "SHOE SIZE", ylab = "HEIGHT (cm)")
abline(h = mean(y), lwd=1.5, col="red")
abline(lm(y ~ x), lwd=1.5, col="blue")

# method 2
lm.y.x <- lm(y ~ x, data = df)
summary(lm.y.x)

###########################
# double check with this
###########################
str(lm.y.x)
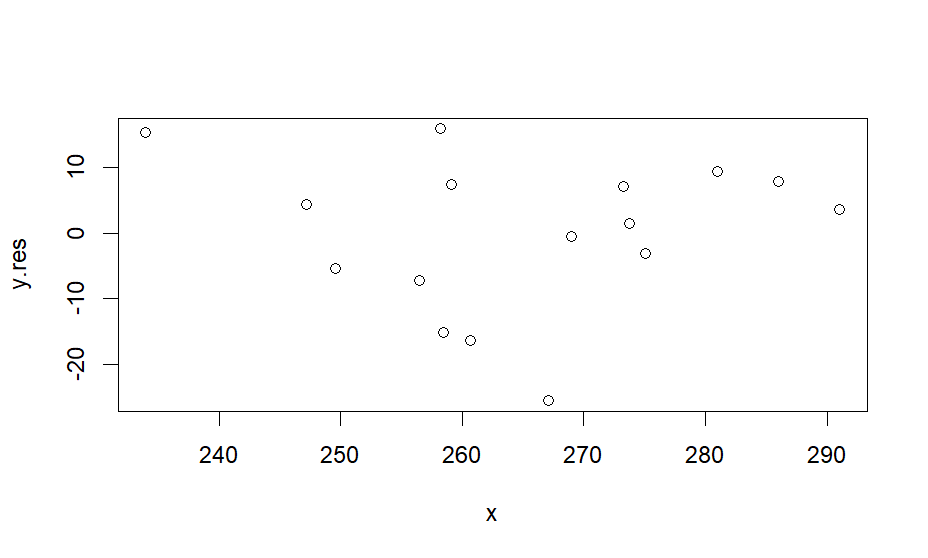
y.res <- lm.y.x$residuals
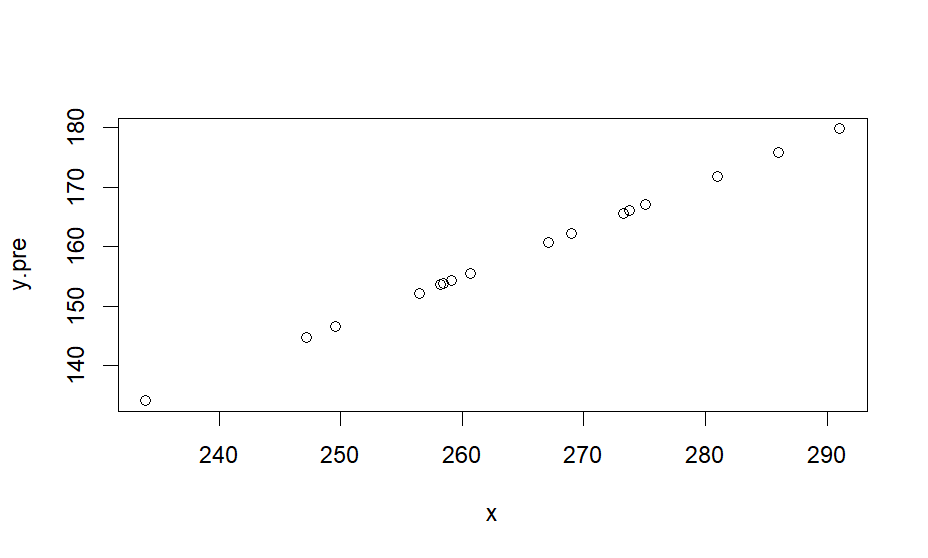
y.pre <- lm.y.x$fitted.values
y.exp <- y.pre - m.y
plot(x,y.pre)
plot(x,y.res)
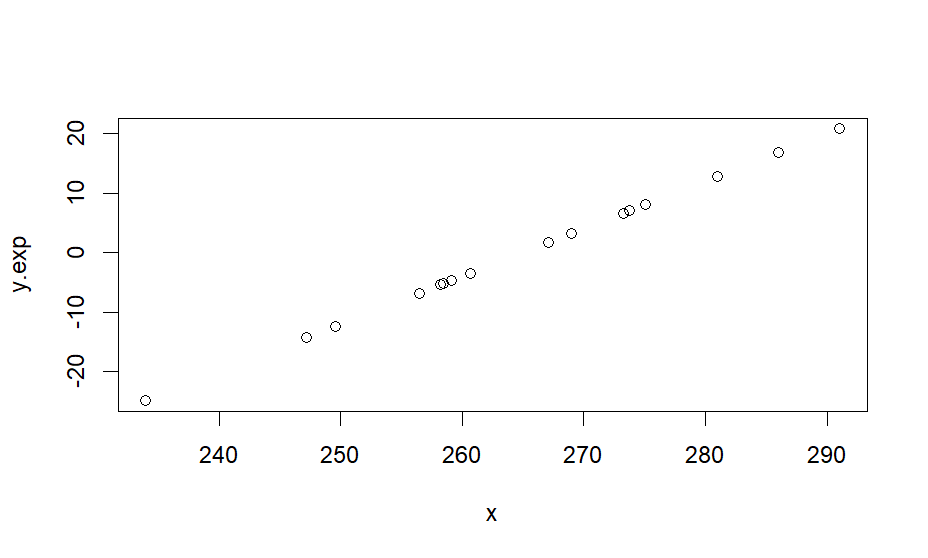
plot(x,y.exp)
###########################
lm.y.x$coefficients
intercept <- lm.y.x$coefficients[1]
slope <- lm.y.x$coefficients[2]
intercept
slope

# library(ggplot2)
# ggplot(data=df, aes(x,y)) +
#  geom_point(color="blue", size=1.5, pch=1.5) +
#  geom_hline(aes(yintercept=mean(y))) +
#  geom_abline(intercept=intercept, slope=slope)
#
#####
ss.y <- sum((y-mean(y))^2)
ss.y
df.y <- length(y)-1
df.y
ss.y/df.y
var(y)

m.x <- mean(x)
m.y <- mean(y)
sp <- sum((x-m.x)*(y-m.y))
df.tot <- n-1
sp/df.tot
cov.xy <- cov(x,y)

sd.x <- sd(x)
sd.y <- sd(y)

r.xy <- cov.xy/(sd.x*sd.y)
r.xy
cor(x,y)
cor.test(x,y)

b <- cov(x,y) / var(x)
# note that
# (sp(x,y)/n-1) / (ss(x)/n-1)
# = sp(x,y) / ss(x)
# m.y = a + b * mean.x
a <- m.y - (b * m.x)
b
a
# we got these from the above
slope
intercept


summary(lm.y.x)
lm.y.x$coefficients
# str(lm.y.x)

y.pred <- lm.y.x$fitted.values
y <- y
m.y

res <- y - y.pred
reg <- y.pred - m.y
ss.y
ss.res <- sum(res^2)
ss.reg <- sum(reg^2)
ss.y
ss.res
ss.reg
ss.res + ss.reg

r.square <- ss.reg / ss.y
r.square
sqrt(r.square)
cor(x,y)

df.tot <- df.y
df.reg <- 2 - 1
df.res <- df.tot - df.reg

df.reg
df.res
df.tot

ss.tot <- ss.y
ss.reg
ss.res
ss.tot

ms.reg <- ss.reg / df.reg
ms.res <- ss.res / df.res
ms.reg
ms.res

f.cal <- ms.reg/ms.res
f.cal

p.val <- pf(f.cal, df.reg, df.res, lower.tail = F)
p.val
anova(lm.y.x)

########################################
# also make it sure that you understand
########################################

res <- lm.y.x$residuals
reg <- lm.y.x$fitted.values-m.y

# The above can be derived as follows
y.hat <- intercept + (slope * x)
y.hat
head(y.hat)
head(lm.y.x$fitted.values)
y.pre <- y.hat
y.res <- y - y.pre
y.res
head(res)
head(y.res)

y.reg <- y.pre - m.y
head(reg)
head(y.reg)
########################################

# This is essentially a perfect linear
# relationship between the regression
# line and x data
lm.reg.x <- lm(reg~x, data = df)
summary(lm.reg.x)

# The relationship between residuals and
# x should be zero
lm.res.x <- lm(res~x, data = df)
summary(lm.res.x)
summary(lm.y.x)

########################################
# Now let's get back to the lm output
# this is to evalue the significance of
# the slope of x (b)
summary(lm.y.x)

# the slope, we already got this
b <- slope
# intercept
a <- intercept

# the real data look like this
plot(x,y)
abline(h = mean(y), lwd=1.5, col="red")
abline(lm(y ~ x), lwd=1.5, col="blue")

# blue line is regression line
# this slope is an estimate of a real
# thing (population) rather than the
# sample we are using right now)
library(ggplot2)

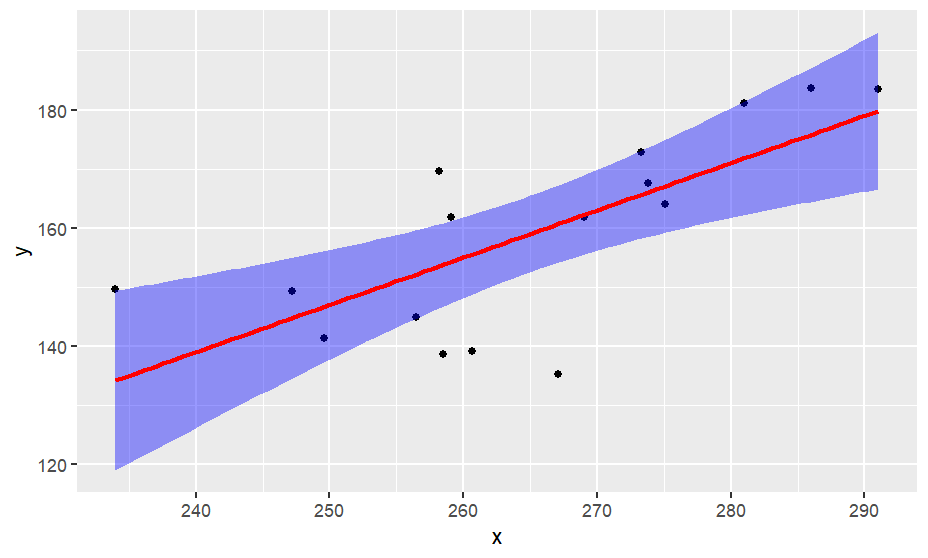
ggplot(data = df, aes(x,y)) +
  geom_point() +
  geom_smooth(method="lm", color="red", fill = "blue")

# the real slope should reside in between
# the violet area. The area is estimated
# with standard error of slop (regression
# coefficient)

# in word
# se for b is
# from summary(lm.y.x)

summary(lm.y.x)
se.b <- 0.0401
ci.se.b <- 1.96 * se.b
# this is the lowest estimate
b - ci.se.b
# the highest estimate
b + ci.se.b
# calculated estimate
b

# how to get se for b?
# https://www.statology.org/standard-error-of-regression-slope/
# see also http://commres.net/wiki/standard_error_of_regression_coefficients

ss.res
ss.x
# we didn't get ss.x
ss.x <- sum((x-m.x)^2)
ss.x

sqrt( (ss.res/(n-2)) / ss.x )
# the above is the same as the below
sqrt( ss.res / (n-2)*ss.x )
sqrt( 1/(n-2) * (ss.res/ss.x))
se.b <- sqrt( 1/(n-2) * (ss.res/ss.x))

# now
summary(lm.y.x)
# if b is 0, b does not do anything (null hypothesis)
# To test if b is working, we do t-test by
# b (current coefficient) - 0 (not working) / se
# = t.calculated. We test if this is significant
# tp(t.b.cal, df=n-2)

t.b.cal <- (b - 0)/se.b
t.b.cal
# k = num of predictor variables
k <- 1
df.t <- n-k-1

2*pt(t.b.cal, df.t, lower.tail = F)
pf(t.b.cal^2, 1, df.t, lower.tail = F)
Output
> ################
> rnorm2 <- function(n,mean,sd) { mean+sd*scale(rnorm(n)) }
> n <- 16
>
> set.seed(101)
> x <- rnorm2(n, 265, 15)
> rand.00 <- rnorm2(n, 0, 12)
>
> rand.01 <- rnorm2(n, 0, 240)
> plot(rand.01)
> points(rand.00, col="red")
>
> b <- 170 / 265
> b <- round(b,1)
> b
[1] 0.6
> y <- b * x + rand.00
>
> df <- data.frame(x, y)
> head(df)
         x        y
1 256.4615 144.9723
2 273.7812 167.6050
3 249.5828 141.2775
4 267.1155 135.1836
5 269.0162 161.7509
6 286.0342 183.7182
>
> # plot method 0
> plot(x,y)
>
> # method 1
> plot(x, y, pch = 1, cex = 1, col = "black", main = "HEIGHT against SHOE SIZE", xlab = "SHOE SIZE", ylab = "HEIGHT (cm)")
> abline(h = mean(y), lwd=1.5, col="red")
> abline(lm(y ~ x), lwd=1.5, col="blue")
>
> # method 2
> lm.y.x <- lm(y ~ x, data = df)
> summary(lm.y.x)

Call:
lm(formula = y ~ x, data = df)

Residuals:
    Min      1Q  Median      3Q     Max
-25.508  -5.847   2.617   7.595  15.963

Coefficients:
            Estimate Std. Error t value Pr(>|t|)
(Intercept) -52.8818    54.9507  -0.962  0.35220
x             0.7996     0.2071   3.862  0.00173 **
---
Signif. codes:  0 ‘***’ 0.001 ‘**’ 0.01 ‘*’ 0.05 ‘.’ 0.1 ‘ ’ 1

Residual standard error: 12.03 on 14 degrees of freedom
Multiple R-squared:  0.5158,	Adjusted R-squared:  0.4812
F-statistic: 14.91 on 1 and 14 DF,  p-value: 0.001727

>
> ###########################
> # double check with this
> ###########################
> str(lm.y.x)
List of 12
 $ coefficients : Named num [1:2] -52.9 0.8
  ..- attr(*, "names")= chr [1:2] "(Intercept)" "x"
 $ residuals    : Named num [1:16] -7.2 1.58 -5.4 -25.51 -0.46 ...
  ..- attr(*, "names")= chr [1:16] "1" "2" "3" "4" ...
 $ effects      : Named num [1:16] -636 -46.45 -3.351 -24.236 0.728 ...
  ..- attr(*, "names")= chr [1:16] "(Intercept)" "x" "" "" ...
 $ rank         : int 2
 $ fitted.values: Named num [1:16] 152 166 147 161 162 ...
  ..- attr(*, "names")= chr [1:16] "1" "2" "3" "4" ...
 $ assign       : int [1:2] 0 1
 $ qr           :List of 5
  ..$ qr   : num [1:16, 1:2] -4 0.25 0.25 0.25 0.25 0.25 0.25 0.25 0.25 0.25 ...
  .. ..- attr(*, "dimnames")=List of 2
  .. .. ..$ : chr [1:16] "1" "2" "3" "4" ...
  .. .. ..$ : chr [1:2] "(Intercept)" "x"
  .. ..- attr(*, "assign")= int [1:2] 0 1
  ..$ qraux: num [1:2] 1.25 1.18
  ..$ pivot: int [1:2] 1 2
  ..$ tol  : num 1e-07
  ..$ rank : int 2
  ..- attr(*, "class")= chr "qr"
 $ df.residual  : int 14
 $ xlevels      : Named list()
 $ call         : language lm(formula = y ~ x, data = df)
 $ terms        :Classes 'terms', 'formula'  language y ~ x
  .. ..- attr(*, "variables")= language list(y, x)
  .. ..- attr(*, "factors")= int [1:2, 1] 0 1
  .. .. ..- attr(*, "dimnames")=List of 2
  .. .. .. ..$ : chr [1:2] "y" "x"
  .. .. .. ..$ : chr "x"
  .. ..- attr(*, "term.labels")= chr "x"
  .. ..- attr(*, "order")= int 1
  .. ..- attr(*, "intercept")= int 1
  .. ..- attr(*, "response")= int 1
  .. ..- attr(*, ".Environment")=<environment: R_GlobalEnv>
  .. ..- attr(*, "predvars")= language list(y, x)
  .. ..- attr(*, "dataClasses")= Named chr [1:2] "numeric" "numeric"
  .. .. ..- attr(*, "names")= chr [1:2] "y" "x"
 $ model        :'data.frame':	16 obs. of  2 variables:
  ..$ y: num [1:16] 145 168 141 135 162 ...
  ..$ x: num [1:16] 256 274 250 267 269 ...
  ..- attr(*, "terms")=Classes 'terms', 'formula'  language y ~ x
  .. .. ..- attr(*, "variables")= language list(y, x)
  .. .. ..- attr(*, "factors")= int [1:2, 1] 0 1
  .. .. .. ..- attr(*, "dimnames")=List of 2
  .. .. .. .. ..$ : chr [1:2] "y" "x"
  .. .. .. .. ..$ : chr "x"
  .. .. ..- attr(*, "term.labels")= chr "x"
  .. .. ..- attr(*, "order")= int 1
  .. .. ..- attr(*, "intercept")= int 1
  .. .. ..- attr(*, "response")= int 1
  .. .. ..- attr(*, ".Environment")=<environment: R_GlobalEnv>
  .. .. ..- attr(*, "predvars")= language list(y, x)
  .. .. ..- attr(*, "dataClasses")= Named chr [1:2] "numeric" "numeric"
  .. .. .. ..- attr(*, "names")= chr [1:2] "y" "x"
 - attr(*, "class")= chr "lm"
> y.res <- lm.y.x$residuals
> y.pre <- lm.y.x$fitted.values
> y.exp <- y.pre - m.y
> plot(x,y.pre)
> plot(x,y.res)
> plot(x,y.exp)
> ###########################
> lm.y.x$coefficients
(Intercept)           x
-52.8817788   0.7995539
> intercept <- lm.y.x$coefficients[1]
> slope <- lm.y.x$coefficients[2]
> intercept
(Intercept)
  -52.88178
> slope
        x
0.7995539
>
> # library(ggplot2)
> # ggplot(data=df, aes(x,y)) +
> #  geom_point(color="blue", size=1.5, pch=1.5) +
> #  geom_hline(aes(yintercept=mean(y))) +
> #  geom_abline(intercept=intercept, slope=slope)
> #
> #####
> ss.y <- sum((y-mean(y))^2)
> ss.y
[1] 4183.193
> df.y <- length(y)-1
> df.y
[1] 15
> ss.y/df.y
[1] 278.8795
> var(y)
         [,1]
[1,] 278.8795
>
> m.x <- mean(x)
> m.y <- mean(y)
> sp <- sum((x-m.x)*(y-m.y))
> df.tot <- n-1
> sp/df.tot
[1] 179.8996
> cov.xy <- cov(x,y)
>
> sd.x <- sd(x)
> sd.y <- sd(y)
>
> r.xy <- cov.xy/(sd.x*sd.y)
> r.xy
          [,1]
[1,] 0.7181756
> cor(x,y)
          [,1]
[1,] 0.7181756
> cor.test(x,y)

	Pearson's product-moment correlation

data:  x and y
t = 3.8616, df = 14, p-value = 0.001727
alternative hypothesis: true correlation is not equal to 0
95 percent confidence interval:
 0.3454526 0.8951901
sample estimates:
      cor
0.7181756

>
> b <- cov(x,y) / var(x)
> # note that
> # (sp(x,y)/n-1) / (ss(x)/n-1)
> # = sp(x,y) / ss(x)
> # m.y = a + b * mean.x
> a <- m.y - (b * m.x)
> b
          [,1]
[1,] 0.7995539
> a
          [,1]
[1,] -52.88178
> # we got these from the above
> slope
        x
0.7995539
> intercept
(Intercept)
  -52.88178
>
>
> summary(lm.y.x)

Call:
lm(formula = y ~ x, data = df)

Residuals:
    Min      1Q  Median      3Q     Max
-25.508  -5.847   2.617   7.595  15.963

Coefficients:
            Estimate Std. Error t value Pr(>|t|)
(Intercept) -52.8818    54.9507  -0.962  0.35220
x             0.7996     0.2071   3.862  0.00173 **
---
Signif. codes:  0 ‘***’ 0.001 ‘**’ 0.01 ‘*’ 0.05 ‘.’ 0.1 ‘ ’ 1

Residual standard error: 12.03 on 14 degrees of freedom
Multiple R-squared:  0.5158,	Adjusted R-squared:  0.4812
F-statistic: 14.91 on 1 and 14 DF,  p-value: 0.001727

> lm.y.x$coefficients
(Intercept)           x
-52.8817788   0.7995539
> # str(lm.y.x)
>
> y.pred <- lm.y.x$fitted.values
> y <- y
> m.y
[1] 159
>
> res <- y - y.pred
> reg <- y.pred - m.y
> ss.y
[1] 4183.193
> ss.res <- sum(res^2)
> ss.reg <- sum(reg^2)
> ss.y
[1] 4183.193
> ss.res
[1] 2025.602
> ss.reg
[1] 2157.592
> ss.res + ss.reg
[1] 4183.193
>
> r.square <- ss.reg / ss.y
> r.square
[1] 0.5157762
> sqrt(r.square)
[1] 0.7181756
> cor(x,y)
          [,1]
[1,] 0.7181756
>
> df.tot <- df.y
> df.reg <- 2 - 1
> df.res <- df.tot - df.reg
>
> df.reg
[1] 1
> df.res
[1] 14
> df.tot
[1] 15
>
> ss.tot <- ss.y
> ss.reg
[1] 2157.592
> ss.res
[1] 2025.602
> ss.tot
[1] 4183.193
>
> ms.reg <- ss.reg / df.reg
> ms.res <- ss.res / df.res
> ms.reg
[1] 2157.592
> ms.res
[1] 144.6858
>
> f.cal <- ms.reg/ms.res
> f.cal
[1] 14.91225
>
> p.val <- pf(f.cal, df.reg, df.res, lower.tail = F)
> p.val
[1] 0.001727459
> anova(lm.y.x)
Analysis of Variance Table

Response: y
          Df Sum Sq Mean Sq F value   Pr(>F)
x          1 2157.6 2157.59  14.912 0.001727 **
Residuals 14 2025.6  144.69
---
Signif. codes:  0 ‘***’ 0.001 ‘**’ 0.01 ‘*’ 0.05 ‘.’ 0.1 ‘ ’ 1
>
> ########################################
> # also make it sure that you understand
> ########################################
>
> res <- lm.y.x$residuals
> reg <- lm.y.x$fitted.values-m.y
>
> # The above can be derived as follows
> y.hat <- intercept + (slope * x)
> y.hat
          [,1]
 [1,] 152.1730
 [2,] 166.0210
 [3,] 146.6731
 [4,] 160.6914
 [5,] 162.2112
 [6,] 175.8179
 [7,] 167.0666
 [8,] 155.5354
 [9,] 171.7678
[10,] 153.7931
[11,] 165.6110
[12,] 144.7831
[13,] 179.8185
[14,] 134.1906
[15,] 153.5815
[16,] 154.2648
attr(,"scaled:center")
[1] 0.1070574
attr(,"scaled:scale")
[1] 0.7608404
> head(y.hat)
         [,1]
[1,] 152.1730
[2,] 166.0210
[3,] 146.6731
[4,] 160.6914
[5,] 162.2112
[6,] 175.8179
> head(lm.y.x$fitted.values)
       1        2        3        4        5        6
152.1730 166.0210 146.6731 160.6914 162.2112 175.8179
> y.pre <- y.hat
> y.res <- y - y.pre
> y.res
             [,1]
 [1,]  -7.2007773
 [2,]   1.5839803
 [3,]  -5.3956693
 [4,] -25.5078178
 [5,]  -0.4602376
 [6,]   7.9002872
 [7,]  -3.0767953
 [8,] -16.3176727
 [9,]   9.3951797
[10,] -15.1613471
[11,]   7.1934473
[12,]   4.4883827
[13,]   3.6498214
[14,]  15.4541201
[15,]  15.9625789
[16,]   7.4925197
attr(,"scaled:center")
[1] 0.1070574
attr(,"scaled:scale")
[1] 0.7608404
> head(res)
          1           2           3           4           5           6
 -7.2007773   1.5839803  -5.3956693 -25.5078178  -0.4602376   7.9002872
> head(y.res)
            [,1]
[1,]  -7.2007773
[2,]   1.5839803
[3,]  -5.3956693
[4,] -25.5078178
[5,]  -0.4602376
[6,]   7.9002872
>
> y.reg <- y.pre - m.y
> head(reg)
         1          2          3          4          5          6
 -6.826963   7.021016 -12.326872   1.691427   3.211157  16.817938
> head(y.reg)
           [,1]
[1,]  -6.826963
[2,]   7.021016
[3,] -12.326872
[4,]   1.691427
[5,]   3.211157
[6,]  16.817938
> ########################################
>
> # This is essentially a perfect linear
> # relationship between the regression
> # line and x data
> lm.reg.x <- lm(reg~x, data = df)
> summary(lm.reg.x)

Call:
lm(formula = reg ~ x, data = df)

Residuals:
       Min         1Q     Median         3Q        Max
-1.216e-14 -9.993e-15 -2.381e-15  7.912e-15  1.822e-14

Coefficients:
              Estimate Std. Error    t value Pr(>|t|)
(Intercept) -2.119e+02  5.321e-14 -3.982e+15   <2e-16 ***
x            7.996e-01  2.005e-16  3.988e+15   <2e-16 ***
---
Signif. codes:  0 ‘***’ 0.001 ‘**’ 0.01 ‘*’ 0.05 ‘.’ 0.1 ‘ ’ 1

Residual standard error: 1.165e-14 on 14 degrees of freedom
Multiple R-squared:      1,	Adjusted R-squared:      1
F-statistic: 1.59e+31 on 1 and 14 DF,  p-value: < 2.2e-16

경고메시지(들):
summary.lm(lm.reg.x)에서:
  essentially perfect fit: summary may be unreliable
>
> # The relationship between residuals and
> # x should be zero
> lm.res.x <- lm(res~x, data = df)
> summary(lm.res.x)

Call:
lm(formula = res ~ x, data = df)

Residuals:
    Min      1Q  Median      3Q     Max
-25.508  -5.847   2.617   7.595  15.963

Coefficients:
              Estimate Std. Error t value Pr(>|t|)
(Intercept) -1.956e-14  5.495e+01       0        1
x            6.880e-17  2.071e-01       0        1

Residual standard error: 12.03 on 14 degrees of freedom
Multiple R-squared:  1.449e-32,	Adjusted R-squared:  -0.07143
F-statistic: 2.029e-31 on 1 and 14 DF,  p-value: 1

> summary(lm.y.x)

Call:
lm(formula = y ~ x, data = df)

Residuals:
    Min      1Q  Median      3Q     Max
-25.508  -5.847   2.617   7.595  15.963

Coefficients:
            Estimate Std. Error t value Pr(>|t|)
(Intercept) -52.8818    54.9507  -0.962  0.35220
x             0.7996     0.2071   3.862  0.00173 **
---
Signif. codes:  0 ‘***’ 0.001 ‘**’ 0.01 ‘*’ 0.05 ‘.’ 0.1 ‘ ’ 1

Residual standard error: 12.03 on 14 degrees of freedom
Multiple R-squared:  0.5158,	Adjusted R-squared:  0.4812
F-statistic: 14.91 on 1 and 14 DF,  p-value: 0.001727

>
> ########################################
> # Now let's get back to the lm output
> # this is to evalue the significance of
> # the slope of x (b)
> summary(lm.y.x)

Call:
lm(formula = y ~ x, data = df)

Residuals:
    Min      1Q  Median      3Q     Max
-25.508  -5.847   2.617   7.595  15.963

Coefficients:
            Estimate Std. Error t value Pr(>|t|)
(Intercept) -52.8818    54.9507  -0.962  0.35220
x             0.7996     0.2071   3.862  0.00173 **
---
Signif. codes:  0 ‘***’ 0.001 ‘**’ 0.01 ‘*’ 0.05 ‘.’ 0.1 ‘ ’ 1

Residual standard error: 12.03 on 14 degrees of freedom
Multiple R-squared:  0.5158,	Adjusted R-squared:  0.4812
F-statistic: 14.91 on 1 and 14 DF,  p-value: 0.001727

>
> # the slope, we already got this
> b <- slope
> # intercept
> a <- intercept
>
> # the real data look like this
> plot(x,y)
> abline(h = mean(y), lwd=1.5, col="red")
> abline(lm(y ~ x), lwd=1.5, col="blue")
>
> # blue line is regression line
> # this slope is an estimate of a real
> # thing (population) rather than the
> # sample we are using right now)
> library(ggplot2)
>
> ggplot(data = df, aes(x,y)) +
+   geom_point() +
+   geom_smooth(method="lm", color="red", fill = "blue")
`geom_smooth()` using formula = 'y ~ x'
>
> # the real slope should reside in between
> # the violet area. The area is estimated
> # with standard error of slop (regression
> # coefficient)
>
> # in word
> # se for b is
> # from summary(lm.y.x)
>
> summary(lm.y.x)

Call:
lm(formula = y ~ x, data = df)

Residuals:
    Min      1Q  Median      3Q     Max
-25.508  -5.847   2.617   7.595  15.963

Coefficients:
            Estimate Std. Error t value Pr(>|t|)
(Intercept) -52.8818    54.9507  -0.962  0.35220
x             0.7996     0.2071   3.862  0.00173 **
---
Signif. codes:  0 ‘***’ 0.001 ‘**’ 0.01 ‘*’ 0.05 ‘.’ 0.1 ‘ ’ 1

Residual standard error: 12.03 on 14 degrees of freedom
Multiple R-squared:  0.5158,	Adjusted R-squared:  0.4812
F-statistic: 14.91 on 1 and 14 DF,  p-value: 0.001727

> se.b <- 0.0401
> ci.se.b <- 1.96 * se.b
> # this is the lowest estimate
> b - ci.se.b
        x
0.7209579
> # the highest estimate
> b + ci.se.b
        x
0.8781499
> # calculated estimate
> b
        x
0.7995539
>
> # how to get se for b?
> # https://www.statology.org/standard-error-of-regression-slope/
> # see also http://commres.net/wiki/standard_error_of_regression_coefficients
>
> ss.res
[1] 2025.602
> ss.x
[1] 3375
> # we didn't get ss.x
> ss.x <- sum((x-m.x)^2)
> ss.x
[1] 3375
>
> sqrt( (ss.res/(n-2)) / ss.x )
[1] 0.2070504
> # the above is the same as the below
> sqrt( ss.res / (n-2)*ss.x )
[1] 698.7952
> sqrt( 1/(n-2) * (ss.res/ss.x))
[1] 0.2070504
> se.b <- sqrt( 1/(n-2) * (ss.res/ss.x))
>
> # now
> summary(lm.y.x)

Call:
lm(formula = y ~ x, data = df)

Residuals:
    Min      1Q  Median      3Q     Max
-25.508  -5.847   2.617   7.595  15.963

Coefficients:
            Estimate Std. Error t value Pr(>|t|)
(Intercept) -52.8818    54.9507  -0.962  0.35220
x             0.7996     0.2071   3.862  0.00173 **
---
Signif. codes:  0 ‘***’ 0.001 ‘**’ 0.01 ‘*’ 0.05 ‘.’ 0.1 ‘ ’ 1

Residual standard error: 12.03 on 14 degrees of freedom
Multiple R-squared:  0.5158,	Adjusted R-squared:  0.4812
F-statistic: 14.91 on 1 and 14 DF,  p-value: 0.001727

> # if b is 0, b does not do anything (null hypothesis)
> # To test if b is working, we do t-test by
> # b (current coefficient) - 0 (not working) / se
> # = t.calculated. We test if this is significant
> # tp(t.b.cal, df=n-2)
>
> t.b.cal <- (b - 0)/se.b
> t.b.cal
       x
3.861639
> # k = num of predictor variables
> k <- 1
> df.t <- n-k-1
>
> 2*pt(t.b.cal, df.t, lower.tail = F)
          x
0.001727459
> pf(t.b.cal^2, 1, df.t, lower.tail = F)
          x
0.001727459
>
Graphics output
c/ms/regression_lecture_note_for_r.txt · Last modified: by hkimscil

