This is an old revision of the document!
Table of Contents
interaction effects in regression analysis
- see also ANCOVA
E.g. 1 One category and one continuous
Data 만들기
> x<-runif(50,0,10)
> f1<-gl(n=2,k=25,labels=c("Low","High"))
> modmat<-model.matrix(~x*f1,data.frame(f1=f1,x=x))
> coeff<-c(1,3,-2,1.5)
> y<-rnorm(n=50,mean=modmat%*%coeff,sd=0.5)
> dat<-data.frame(y=y,f1=f1,x=x)
작물의 무게가 온도와 토양의 질소에 영향을 받을까? 라는 연구문제에서 추출된 데이터. 작물무게에 대한 질소함유량의 영향과 온도의 영향, 그리고 그 두 변인의 상호작용효과에 대해서 알고 싶다.
> dat
            y   f1           x
1  21.8693480  Low 7.128280776
2   9.9550750  Low 3.085331542
3  10.9473336  Low 3.535275350
4  17.1011539  Low 5.611984141
5   7.1786120  Low 1.734487077
6  20.9093423  Low 6.526126855
7  25.8828775  Low 8.139958519
8   5.3130186  Low 1.629746817
9   6.7978354  Low 1.820823189
10 20.2008030  Low 6.450495571
11  5.6307366  Low 1.438263836
12 24.5176666  Low 7.829027227
13  2.9836344  Low 0.602117125
14 24.9027322  Low 8.016709497
15  7.1347831  Low 2.223906002
16 21.0629404  Low 6.658385394
17  4.9330174  Low 1.169058718
18 23.3587524  Low 7.323669230
19 11.5338189  Low 3.576785533
20 28.2193423  Low 9.245026903
21  5.9288641  Low 1.655559973
22  4.4854811  Low 1.199908606
23 18.5213789  Low 5.978340823
24  3.5410098  Low 0.717360801
25 14.1031612  Low 4.403464922
26  4.2389757 High 1.241753022
27 23.2650544 High 5.428188895
28 24.0330453 High 5.586834035
29 16.6518724 High 3.913568701
30  4.2317570 High 1.012214390
31 26.1115118 High 5.969692939
32 13.1004694 High 3.023571330
33 39.8678989 High 9.080975151
34 16.2227452 High 3.806260177
35 24.8683087 High 5.562874263
36 43.4090915 High 9.818060326
37 -0.2444546 High 0.007114746
38 11.1822149 High 2.640837491
39 43.5794651 High 9.933570819
40 25.3860623 High 5.960662568
41 26.5072704 High 6.139642103
42 30.6778013 High 6.968976315
43 27.4982726 High 6.315991175
44 16.3318687 High 3.883612270
45 37.8328875 High 8.564988615
46 12.6958950 High 2.722899497
47 32.9697332 High 7.371928061
48 39.6831930 High 9.026269785
49 41.7586348 High 9.542581048
50 15.9704872 High 3.644464843
> mod <- lm(y~x*f1)
> summary(mod)

Residuals:
    Min      1Q  Median      3Q     Max
-0.9627 -0.2945 -0.1238  0.3386  0.9835

Coefficients:
            Estimate Std. Error t value Pr(>|t|)
(Intercept)  1.35817    0.17959   7.563 1.31e-09 ***
x            2.95059    0.03187  92.577  < 2e-16 ***
f1High      -2.63301    0.25544 -10.308 1.54e-13 ***
x:f1High     1.59598    0.04713  33.867  < 2e-16 ***
---
Signif. codes:  0 ‘***’ 0.001 ‘**’ 0.01 ‘*’ 0.05 ‘.’ 0.1 ‘ ’ 1

Residual standard error: 0.4842 on 46 degrees of freedom
Multiple R-squared:  0.9983,    Adjusted R-squared:  0.9981
F-statistic:  8792 on 3 and 46 DF,  p-value: < 2.2e-16
coefficient 해석
- 우선 f1High 라는 변인은 High 상태(온도가 높은 상태)를 의미. 따라서 default 값(제어된 값)은 온도가 낮은 상태 (low).
- 절편 = 온도가 Low인 상태(제어상태)이며 x변인(질소)이 0인 상태일 때의 작물의 무게가 1.3g정도 된다는 것을 말한다.
- 다음의 x는 x변인(질소)의 단위가 1씩 증가할 때마다 작물의 무게는 2.9씩 증가한다는 것을 말한다. (일반적인 regression line 해석)
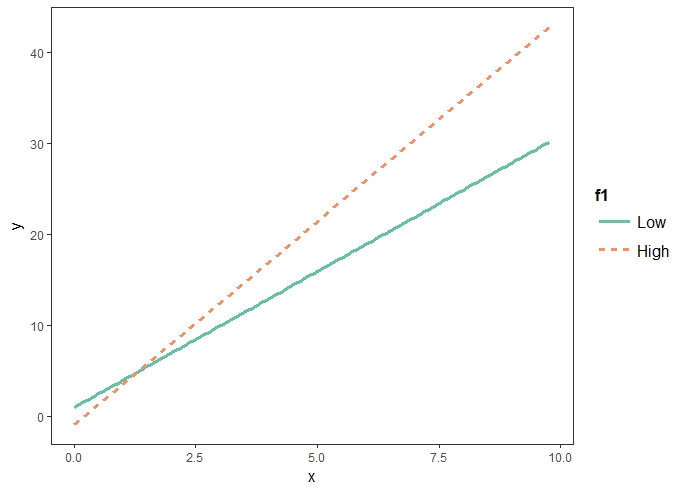
- 다음 x:f1High는 온도가 High일경우에 x의 영향력이 1.59 더 많다는 것을 말한다. 즉, x의 기울기(slope)는 온도에 따라서 변하는데, 온도가 높은 상태일 경우에 2.90 + 1.59 = 4.54임을 말한다.
library(ggplot2)
library(jtools) # in case not loading, install.packages("jtools")

interact_plot(mod, pred = "x", modx = "f1")
Two category variables
> set.seed(12)
> f1<-gl(n=2,k=30,labels=c("Low","High"))
> f2<-as.factor(rep(c("A","B","C"),times=20))
> modmat<-model.matrix(~f1*f2,data.frame(f1=f1,f2=f2))
> coeff<-c(1,3,-2,-4,1,-1.2)
> y<-rnorm(n=60,mean=modmat%*%coeff,sd=0.1)
> dat<-data.frame(y=y,f1=f1,f2=f2)
> dat
            y   f1 f2
1   0.8519432  Low  A
2  -0.8422831  Low  B
3  -3.0956744  Low  C
4   0.9079995  Low  A
5  -1.1997642  Low  B
6  -3.0272296  Low  C
7   0.9684651  Low  A
8  -1.0628255  Low  B
9  -3.0106464  Low  C
10  1.0428015  Low  A
11 -1.0777720  Low  B
12 -3.1293882  Low  C
13  0.9220433  Low  A
14 -0.9988048  Low  B
15 -3.0152416  Low  C
16  0.9296536  Low  A
17 -0.8811121  Low  B
18 -2.9659488  Low  C
19  1.0506968  Low  A
20 -1.0293305  Low  B
21 -2.9776359  Low  C
22  1.2007201  Low  A
23 -0.8988021  Low  B
24 -3.0302459  Low  C
25  0.8974755  Low  A
26 -1.0267385  Low  B
27 -3.0199106  Low  C
28  1.0131123  Low  A
29 -0.9854200  Low  B
30 -2.9637935  Low  C
31  4.0673981 High  A
32  3.2072036 High  B
33 -1.2541029 High  C
34  3.8929508 High  A
35  2.9627543 High  B
36 -1.2485141 High  C
37  4.0274784 High  A
38  2.9520487 High  B
39 -1.1201895 High  C
40  3.8995549 High  A
41  3.0104984 High  B
42 -1.3155993 High  C
43  4.0578135 High  A
44  2.8404374 High  B
45 -1.2308504 High  C
46  4.0449466 High  A
47  2.9022947 High  B
48 -1.1810002 High  C
49  4.0731453 High  A
50  2.9507401 High  B
51 -1.2042685 High  C
52  3.9887329 High  A
53  3.0456827 High  B
54 -0.9979665 High  C
55  3.8949110 High  A
56  3.0734652 High  B
57 -1.1460750 High  C
58  3.8685727 High  A
59  2.9749961 High  B
60 -1.1685795 High  C
> mod2 <- lm(y~f1*f2)
> summary(mod2)

Call:
lm(formula = y ~ f1 * f2)

Residuals:
      Min        1Q    Median        3Q       Max
-0.199479 -0.063752 -0.001089  0.058162  0.222229

Coefficients:
            Estimate Std. Error t value Pr(>|t|)
(Intercept)  0.97849    0.02865   34.15   <2e-16 ***
f1High       3.00306    0.04052   74.11   <2e-16 ***
f2B         -1.97878    0.04052  -48.83   <2e-16 ***
f2C         -4.00206    0.04052  -98.77   <2e-16 ***
f1High:f2B   0.98924    0.05731   17.26   <2e-16 ***
f1High:f2C  -1.16620    0.05731  -20.35   <2e-16 ***
---
Signif. codes:  0 ‘***’ 0.001 ‘**’ 0.01 ‘*’ 0.05 ‘.’ 0.1 ‘ ’ 1

Residual standard error: 0.09061 on 54 degrees of freedom
Multiple R-squared:  0.9988,	Adjusted R-squared:  0.9987
F-statistic:  8785 on 5 and 54 DF,  p-value: < 2.2e-16
- 온도: Low, High
- 질소: A, B, C (Low, Medium, High)
- 각각 Low가 control인 상태 (아웃풋에 High와 Medium, High)에 대한 정보가 출력)
이 때 coefficients를 이용해서 모델을 해석해보면
- 우선 f1High, f2B, f2C 가 나타나는 것은 f1Low, f2A가 default임을 의미 (즉, 온도가 낮고 질소함유량이 낮은 상태).
- (절편): 제어상태에서 (default = 둘다 Low = 온도가 낮고 질소가 낮은 상태) 식물의 줄기가 0.98cm 일 것임을 알 수 있다. 베이스라인으로 삼는다.
- f1High: 온도가 높고 질소가 낮은 상태에서 베이스라인에 비해서 3cm 크다.
- f2B:온도가 낮고 (제어상태) 질소가 Medium인 상태이면 베이스라인에 비해서 1.97cm 작다
- f2C: 온도가 낮고 (제어상태) 질소가 High인 상태이면 베이스라인에 비해서 4cm 작다
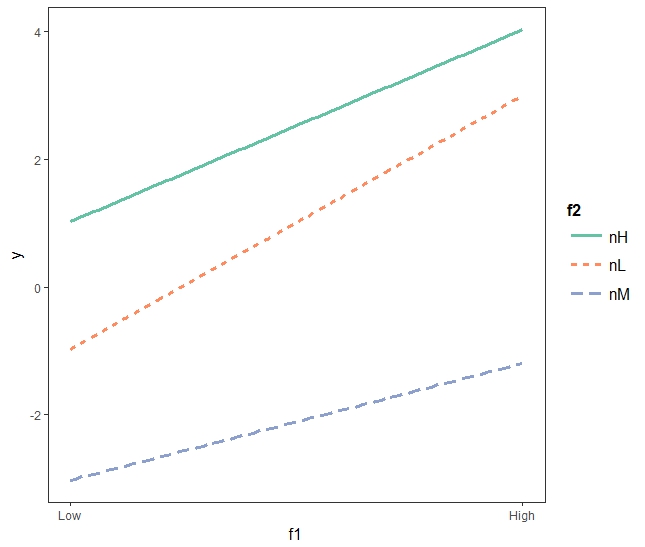
- f1High:f2B : 질소가 Medium이고 온도가 높은 상태이면, 질소가 미디엄이고 온도가 낮은 상태일 때보다 그 영향력이 1정도 증가한다. 즉, 질소 Medium: 온도High일 경우의 줄기의 길이는 -1.97 + 0.98 정도가 된다.
- f1High:f2C : 질소가 High이고 온도도 High인 상태 -1.16 감소한다.
interact_plot(mod2, pred = "f1", modx = "f2")
Two continuous variables
# third case interaction between two continuous variables
x1 <- runif(50, 0, 10)
x2 <- rnorm(50, 10, 3)
modmat <- model.matrix(~x1 * x2, data.frame(x1 = x1, x2 = x2))
coeff <- c(1, 2, -1, 1.5)
y <- rnorm(50, mean = modmat %*% coeff, sd = 0.5)
dat <- data.frame(y = y, x1 = x1, x2 = x2)
x1 = 온도
x2 = 질소응축량
y = bio mass (질량)
> dat
            y        x1        x2
1  127.225898 6.5782952 12.691470
2  134.976325 8.8407710  9.469827
3  172.978836 8.3999093 13.341127
4  129.187350 9.4216319  8.374333
5   95.970590 8.0393706  7.109805
6  113.477078 6.5829466 11.129345
7   66.270095 5.7813667  7.045979
8  126.863453 6.5519038 12.692678
9  131.624939 7.9795107 10.387788
10 110.456358 5.6903306 13.101109
11 115.479155 8.0144395  8.973132
12  29.528690 2.1448570 11.356844
13 128.318557 9.7465562  7.915786
14  18.921754 1.7368538  9.282959
15  -4.831214 0.1580690  6.978103
16 213.682344 8.8949841 15.780156
17 134.921126 8.3425580 10.154291
18 146.226900 6.4058502 15.401571
19 119.274576 8.7390817  8.345627
20  94.838213 5.9467854 10.321177
21  50.691137 2.9965236 12.367372
22 125.448494 8.4011628  9.267234
23 100.976142 5.9883009 11.152540
24  78.031250 7.1031208  6.492293
25  66.181384 3.3381367 14.554817
26  90.815310 5.8215147 10.218944
27  55.743255 4.2758748  8.416975
28 118.803590 8.6829426  8.426423
29  82.299096 4.5885828 12.240702
30  44.017352 4.2597642  6.452758
31  23.497249 2.6309321  5.935875
32 117.951117 7.9018964  9.363143
33   8.991443 1.0185476  9.731556
34   5.058066 0.8347121 10.771098
35  66.388066 3.5050761 13.612861
36 104.674052 6.9962838  9.477907
37 128.949834 6.9733668 12.070650
38   2.044139 0.6649924 11.240154
39  40.474643 4.2937384  5.708563
40  23.123469 2.5003389  6.100993
41 104.160548 5.0169870 14.210050
42  76.096597 5.2981234  9.341949
43  11.664929 1.0132115 16.397473
44  29.467472 3.6711480  4.499590
45  60.244671 4.1991523  9.668471
46  93.168095 5.1471371 12.297131
47 151.389142 8.7788236 10.970514
48 123.343902 9.5301753  7.793863
49  96.091697 4.9067381 13.437151
50  93.531181 6.4740823  9.165288
> summary(lm(y ~ x1 * x2))

Residuals:
     Min       1Q   Median       3Q      Max
-0.68519 -0.19426 -0.03194  0.18262  0.71513

Coefficients:
            Estimate Std. Error t value Pr(>|t|)
(Intercept)  0.965921   0.284706   3.393  0.00143 **
x1           1.995115   0.049260  40.502  < 2e-16 ***
x2          -0.993288   0.027835 -35.685  < 2e-16 ***
x1:x2        1.499595   0.004651 322.443  < 2e-16 ***
---
Signif. codes:
0 ‘***’ 0.001 ‘**’ 0.01 ‘*’ 0.05 ‘.’ 0.1 ‘ ’ 1

Residual standard error: 0.3264 on 46 degrees of freedom
Multiple R-squared:      1,    Adjusted R-squared:      1
F-statistic: 4.661e+05 on 3 and 46 DF,  p-value: < 2.2e-16
- (Intercept): at 0°C and with nitrogen concentration of 0 mg/g일때의 작물의 바이오매스량이 0.96 mg/g
- x1: nitrogen concentration of 0mg/g인 상태에서 1°C 증가할 때 마다 작물의 바이오매스량이 2 mg/g 증가
- x2: temperature of 0°C 상태에서 nitrogen concentration 이 1 mg/g 증가할 때 마다 작물의 바이오매스량이 ~1 mg/g 정도씩 감소
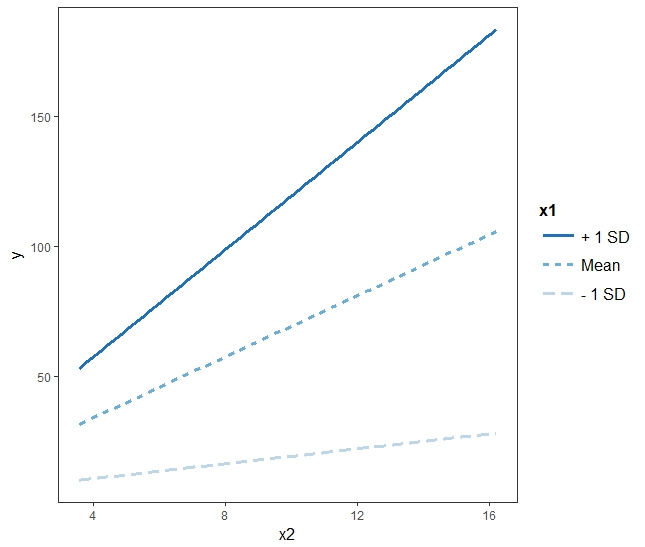
- x1:x2 : 질소량이 1씩 증가할 때 마다, 온도의 영향력은 1.5식 증가한다. 예를 들면 질소량이 0일 경우, 온도와 작물 간의 기울기는 약 2인데, 질소의 양이 1 증가하고 온도가 1 증가하면 기울기는 2 + 1.5 = 3.5가 된다.

yhat = 0.965921 + 1.995115*temp + -0.993288*nitro + 1.499595*inter
- 위의 그림에서 regression 라인 3개는 온도가 각각 0, 5, 10일 경우의 라인을 그린 것.
interact_plot(mod3, pred = "x2", modx = "x1")
E.g.2
states.rds
Download the data file to c:/Rstatistics first. Then
do
states.data <- readRDS("c:/Rstatistics/dataSets/states.rds")
Or, read the above data file directly
z <- gzcon(url("http://commres.net/wiki/_media/r/states.rds"))
data <- readRDS(z)

head(states.data,5)
       state region      pop   area density metro waste energy miles
1    Alabama  South  4041000  52423   77.08  67.4  1.11    393  10.5
2     Alaska   West   550000 570374    0.96  41.1  0.91    991   7.2
3    Arizona   West  3665000 113642   32.25  79.0  0.79    258   9.7
4   Arkansas  South  2351000  52075   45.15  40.1  0.85    330   8.9
5 California   West 29760000 155973  190.80  95.7  1.51    246   8.7
  toxic green house senate csat vsat msat percent expense income high
1 27.86 29.25    30     10  991  476  515       8    3627 27.498 66.9
2 37.41    NA     0     20  920  439  481      41    8330 48.254 86.6
3 19.65 18.37    13     33  932  442  490      26    4309 32.093 78.7
4 24.60 26.04    25     37 1005  482  523       6    3700 24.643 66.3
5  3.26 15.65    50     47  897  415  482      47    4491 41.716 76.2
  college
1    15.7
2    23.0
3    20.3
4    13.3
5    23.4

> tail(states.data,5)
           state  region     pop  area density metro waste energy
47      Virginia   South 6187000 39598  156.25  72.5  1.45    306
48    Washington    West 4867000 66582   73.10  81.7  1.05    389
49 West Virginia   South 1793000 24087   74.44  36.4  0.95    415
50     Wisconsin Midwest 4892000 54314   90.07  67.4  0.70    288
51       Wyoming    West  454000 97105    4.68  29.6  0.70    786
   miles toxic  green house senate csat vsat msat percent expense
47   9.7 12.87  18.72    33     54  890  424  466      60    4836
48   9.2  8.51  16.51    52     64  913  433  480      49    5000
49   8.6 21.30  51.14    48     57  926  441  485      17    4911
50   9.1  9.20  20.58    47     57 1023  481  542      11    5871
51  12.8 25.51 114.40     0     10  980  466  514      13    5723
   income high college
47 38.838 75.2    24.5
48 36.338 83.8    22.9
49 24.233 66.0    12.3
50 34.309 78.6    17.7
51 31.576 83.0    18.8
> data.info <- data.frame(attributes(data)[c("names", "var.labels")])
> # attributes(data) reveals various attributes of the data file,
> # which contains variable names and labels.
> data.info
     names                      var.labels
1    state                           State
2   region             Geographical region
3      pop                 1990 population
4     area         Land area, square miles
5  density          People per square mile
6    metro Metropolitan area population, %
7    waste    Per capita solid waste, tons
8   energy Per capita energy consumed, Btu
9    miles    Per capita miles/year, 1,000
10   toxic Per capita toxics released, lbs
11   green Per capita greenhouse gas, tons
12   house    House '91 environ. voting, %
13  senate   Senate '91 environ. voting, %
14    csat        Mean composite SAT score
15    vsat           Mean verbal SAT score
16    msat             Mean math SAT score
17 percent       % HS graduates taking SAT
18 expense Per pupil expenditures prim&sec
19  income Median household income, $1,000
20    high             % adults HS diploma
21 college         % adults college degree
> str(states.data$region)
 Factor w/ 4 levels "West","N. East",..: 3 1 1 3 1 1 2 3 NA 3 ...
# or
> attributes(data)["label.table"]
$label.table
$label.table$region
   West N. East   South Midwest
      1       2       3       4
Simple regression
Political leaders may use mean SAT scores to make pointed comparisons between the educational systems of different US states. For example, some have raised the question of whether SAT scores are higher in states that spend more money on education. So, we regress per-pupil expenditures(expense) on SAT score (csat).
oneIV.model <- lm(csat ~ expense, data=states.data)
# 18 expense Per pupil expenditures prim&sec

summary(oneIV.model)

Call:
lm(formula = csat ~ expense, data = states.data)

Residuals:
     Min       1Q   Median       3Q      Max
-131.811  -38.085    5.607   37.852  136.495

Coefficients:
              Estimate Std. Error t value Pr(>|t|)
(Intercept)  1.061e+03  3.270e+01   32.44  < 2e-16 ***
expense     -2.228e-02  6.037e-03   -3.69 0.000563 ***
---
Signif. codes:  0 ‘***’ 0.001 ‘**’ 0.01 ‘*’ 0.05 ‘.’ 0.1 ‘ ’ 1

Residual standard error: 59.81 on 49 degrees of freedom
Multiple R-squared:  0.2174,	Adjusted R-squared:  0.2015
F-statistic: 13.61 on 1 and 49 DF,  p-value: 0.0005631
As spending money on education, SAT scores gotten low? In other words, the more money a state spends on education, the lower its students' SAT scores. It is confirmed via:
- coefficient of expense: -2.228e-02 = -0.0228
- R2: 0.2174
- F (1,49) = 13.61 at p = 0.0005631
twoIV.model <- lm(csat ~ expense + percent, data = states.data)
# 18 expense Per pupil expenditures prim&sec
# 17 percent       % HS graduates taking SAT

summary(twoIV.model)

Call:
lm(formula = csat ~ expense + percent, data = states.data)

Residuals:
    Min      1Q  Median      3Q     Max
-62.921 -24.318   1.741  15.502  75.623

Coefficients:
              Estimate Std. Error t value Pr(>|t|)
(Intercept) 989.807403  18.395770  53.806  < 2e-16 ***
expense       0.008604   0.004204   2.046   0.0462 *
percent      -2.537700   0.224912 -11.283 4.21e-15 ***
---
Signif. codes:  0 ‘***’ 0.001 ‘**’ 0.01 ‘*’ 0.05 ‘.’ 0.1 ‘ ’ 1

Residual standard error: 31.62 on 48 degrees of freedom
Multiple R-squared:  0.7857,	Adjusted R-squared:  0.7768
F-statistic: 88.01 on 2 and 48 DF,  p-value: < 2.2e-16
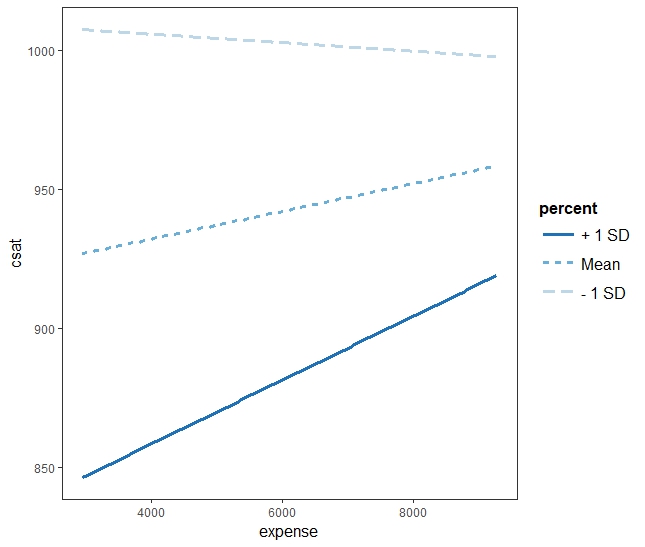
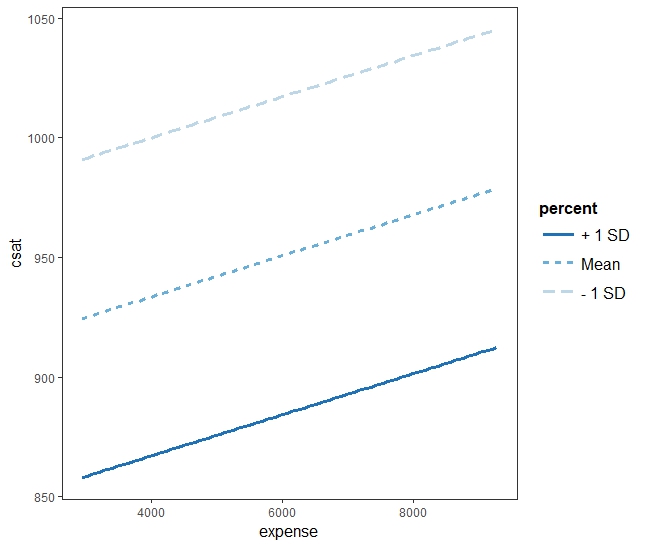
Then, what if we investigate an interaction effects of the two IVs?
twoIV.inta.model <- lm(csat ~ expense * percent, data = states.data)
summary(twoIV.inta.model)

Call:
lm(formula = csat ~ expense * percent, data = states.data)

Residuals:
    Min      1Q  Median      3Q     Max
-65.359 -19.608  -3.046  17.528  76.176

Coefficients:
                  Estimate Std. Error t value Pr(>|t|)
(Intercept)      1.048e+03  3.564e+01  29.415  < 2e-16 ***
expense         -3.917e-03  7.756e-03  -0.505   0.6159
percent         -3.809e+00  7.037e-01  -5.412 2.06e-06 ***
expense:percent  2.490e-04  1.310e-04   1.901   0.0635 .
---
Signif. codes:  0 ‘***’ 0.001 ‘**’ 0.01 ‘*’ 0.05 ‘.’ 0.1 ‘ ’ 1

Residual standard error: 30.8 on 47 degrees of freedom
Multiple R-squared:  0.801,	Adjusted R-squared:  0.7883
F-statistic: 63.07 on 3 and 47 DF,  p-value: < 2.2e-16

>
library(ggplot2)
library(jtools) # in case not loading, install.packages("jtools")
interact_plot(twoIV.inta.model, pred = "expense", modx = "percent")
interact_plot(twoIV.model, pred = "expense", modx = "percent")
One categorical IV
> attributes(data)["label.table"]
$label.table
$label.table$region
   West N. East   South Midwest
      1       2       3       4
> sat.region <- lm(csat ~ region, data=states.data)
> summary(sat.region)

Call:
lm(formula = csat ~ region, data = states.data)

Residuals:
     Min       1Q   Median       3Q      Max
-145.083  -29.389   -3.778   35.192   85.000

Coefficients:
              Estimate Std. Error t value Pr(>|t|)
(Intercept)     946.31      14.80  63.958  < 2e-16 ***
regionN. East   -56.75      23.13  -2.453  0.01800 *
regionSouth     -16.31      19.92  -0.819  0.41719
regionMidwest    63.78      21.36   2.986  0.00451 **
---
Signif. codes:  0 ‘***’ 0.001 ‘**’ 0.01 ‘*’ 0.05 ‘.’ 0.1 ‘ ’ 1

Residual standard error: 53.35 on 46 degrees of freedom
  (1 observation deleted due to missingness)
Multiple R-squared:  0.3853,	Adjusted R-squared:  0.3452
F-statistic:  9.61 on 3 and 46 DF,  p-value: 4.859e-05
regionWest:       946.31 + 0     = 946.31
regionN. East:    946.31 - 56.75 = 889.56
regionSouth:      946.31 - 16.31 = 930
regionMidwest:    946.31 + 63.78 = 1010.09
One numerical and one categorical IV
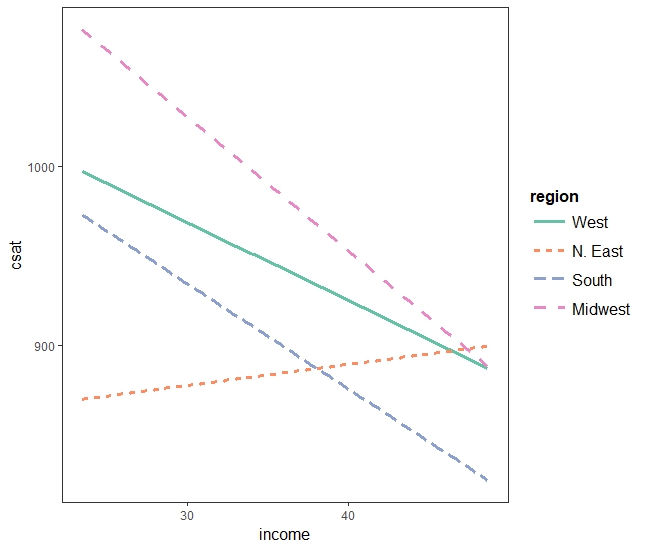
> sat.ri <- lm(csat ~ income * region, data=states.data)
> #Show the results
> summary(sat.ri)

Call:
lm(formula = csat ~ income * region, data = states.data)

Residuals:
     Min       1Q   Median       3Q      Max
-135.962  -20.479   -0.973   28.308   81.188

Coefficients:
                     Estimate Std. Error t value Pr(>|t|)
(Intercept)          1099.843     74.252  14.812   <2e-16 ***
income                 -4.369      2.080  -2.100   0.0418 *
regionN. East        -257.071    134.989  -1.904   0.0637 .
regionSouth            11.062     95.176   0.116   0.9080
regionMidwest         151.386    148.286   1.021   0.3131
income:regionN. East    5.543      3.489   1.588   0.1197
income:regionSouth     -1.509      2.815  -0.536   0.5947
income:regionMidwest   -3.089      4.462  -0.692   0.4926
---
Signif. codes:  0 ‘***’ 0.001 ‘**’ 0.01 ‘*’ 0.05 ‘.’ 0.1 ‘ ’ 1

Residual standard error: 46.8 on 42 degrees of freedom
  (1 observation deleted due to missingness)
Multiple R-squared:  0.568,	Adjusted R-squared:  0.4959
F-statistic: 7.887 on 7 and 42 DF,  p-value: 4.366e-06

>
interact_plot(sat.ri, pred = "income", modx = "region")
E.g. 3
data: state.x77 in r
?state.x77
attributes(state.x77)
> attributes(state.x77)
$dim
[1] 50  8

$dimnames
$dimnames[[1]]
 [1] "Alabama"        "Alaska"         "Arizona"
 [4] "Arkansas"       "California"     "Colorado"
 [7] "Connecticut"    "Delaware"       "Florida"
[10] "Georgia"        "Hawaii"         "Idaho"
[13] "Illinois"       "Indiana"        "Iowa"
[16] "Kansas"         "Kentucky"       "Louisiana"
[19] "Maine"          "Maryland"       "Massachusetts"
[22] "Michigan"       "Minnesota"      "Mississippi"
[25] "Missouri"       "Montana"        "Nebraska"
[28] "Nevada"         "New Hampshire"  "New Jersey"
[31] "New Mexico"     "New York"       "North Carolina"
[34] "North Dakota"   "Ohio"           "Oklahoma"
[37] "Oregon"         "Pennsylvania"   "Rhode Island"
[40] "South Carolina" "South Dakota"   "Tennessee"
[43] "Texas"          "Utah"           "Vermont"
[46] "Virginia"       "Washington"     "West Virginia"
[49] "Wisconsin"      "Wyoming"

$dimnames[[2]]
[1] "Population" "Income"     "Illiteracy" "Life Exp"
[5] "Murder"     "HS Grad"    "Frost"      "Area"
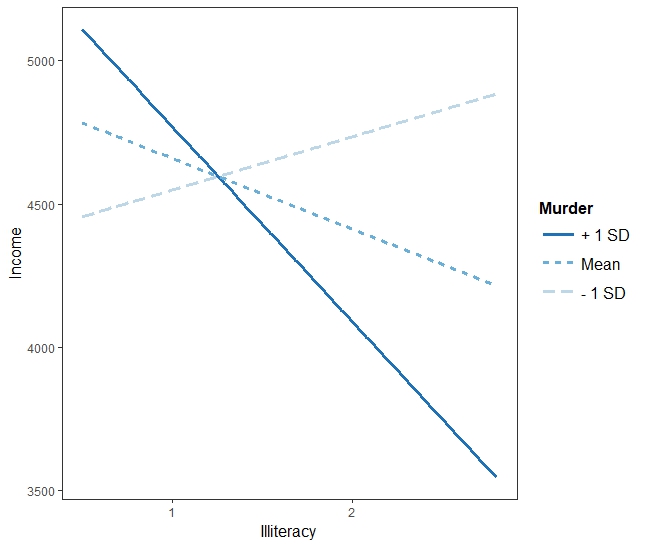
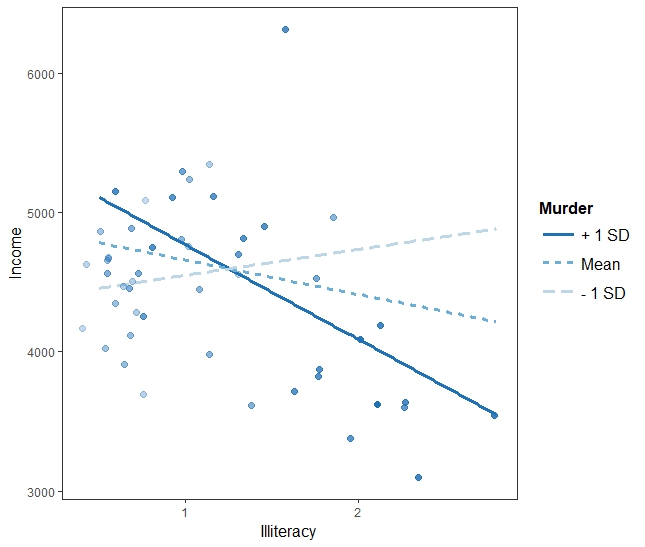
fiti <- lm(Income ~ Illiteracy * Murder, data = as.data.frame(state.x77))
summary(fiti)
Call:
lm(formula = Income ~ Illiteracy * Murder, data = as.data.frame(state.x77))

Residuals:
    Min      1Q  Median      3Q     Max
-955.20 -325.99   10.66  299.96 1892.12

Coefficients:
                  Estimate Std. Error t value Pr(>|t|)
(Intercept)        3822.61     405.33   9.431 2.54e-12 ***
Illiteracy          617.34     434.85   1.420  0.16245
Murder              146.82      50.33   2.917  0.00544 **
Illiteracy:Murder  -117.10      40.13  -2.918  0.00544 **
---
Signif. codes:  0 ‘***’ 0.001 ‘**’ 0.01 ‘*’ 0.05 ‘.’ 0.1 ‘ ’ 1

Residual standard error: 520.1 on 46 degrees of freedom
Multiple R-squared:  0.3273,	Adjusted R-squared:  0.2834
F-statistic: 7.461 on 3 and 46 DF,  p-value: 0.000359

>
> interact_plot(fiti, pred = "Illiteracy", modx = "Murder")
interact_plot(fiti, pred = "Illiteracy", modx = "Murder", plot.points = TRUE)
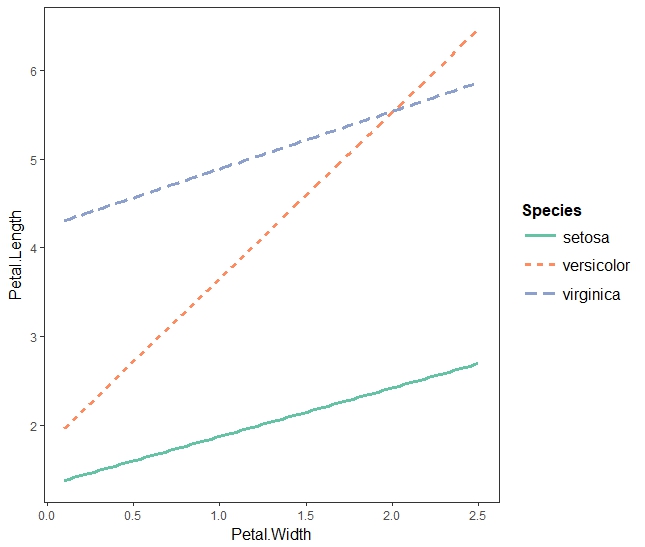
fitiris <- lm(Petal.Length ~ Petal.Width * Species, data = iris)
interact_plot(fitiris, pred = "Petal.Width", modx = "Species")
Ex.
Use Cars93 dataset.
What is affecting city mileage?
1. EngineSize
2. EngineSize * Origin
3. EngineSize + Length
4. EngineSize * Length
Print out the summaries of each lm + interaction graph.
Interprete what has been found.
Ex. 2
library(foreign)
library(msm)

d <- read.dta("https://stats.idre.ucla.edu/stat/data/hsbdemo.dta")
attach(d)
attributes(d)
summary(cbind(read, math, socst))
- Do a regression test on read score with math
- Do a regression test on read with socst
- What do the two test tell you?
- Now,
- Do a regression test on read score with math and socst (interaction effects considered or included).
- How do you interpret the result.
- Draw a plot to make your interpretation easy to understand


