text_mining
This is an old revision of the document!
Table of Contents
References
E.g. 2 mode matrix data
Load data
setwd("d:/rdata")
load("data/termDocMatrix.rdata") # load termDocMatrix
termDocMatrix[5:10,1:20] # inspect part of the matrix
> load("termDocMatrix.rdata") # load termDocMatrix
> termDocMatrix[5:10,1:20] # inspect part of the matrix
              Docs
Terms          1 2 3 4 5 6 7 8 9 10 11 12 13 14 15 16 17 18 19 20
  data         1 1 0 0 1 0 0 0 0  0  1  1  1  1  1  0  1  0  0  0
  examples     0 0 0 0 0 0 0 0 0  0  0  0  0  0  0  0  0  0  0  0
  introduction 0 0 0 0 0 0 0 0 0  0  0  0  0  0  0  0  0  0  0  1
  mining       0 0 0 0 0 0 0 0 0  0  0  1  1  0  1  0  0  0  0  0
  network      0 0 0 0 0 0 0 0 0  0  0  0  0  0  0  1  0  1  1  1
  package      0 0 0 1 1 0 0 0 0  0  0  1  0  0  0  0  0  0  0  0
Terms x Documents matrix data = two mode matrix data
Transform Data into an Adjacency Matrix
termDocMatrix[termDocMatrix>=1] <- 1 # change it to a Boolean matrix
termMatrix <- termDocMatrix %*% t(termDocMatrix) # transform into a term-term adjacency matrix
termMatrix[5:10,5:10] # inspect terms numbered 5 to 10
> termDocMatrix[termDocMatrix>=1] <- 1 # change it to a Boolean matrix
> termMatrix <- termDocMatrix %*% t(termDocMatrix) # transform into a term-term adjacency matrix
> termMatrix[5:10,5:10] # inspect terms numbered 5 to 10
              Terms
Terms          data examples introduction mining network package
  data           53        5            2     34       0       7
  examples        5       17            2      5       2       2
  introduction    2        2           10      2       2       0
  mining         34        5            2     47       1       5
  network         0        2            2      1      17       1
  package         7        2            0      5       1      21
>
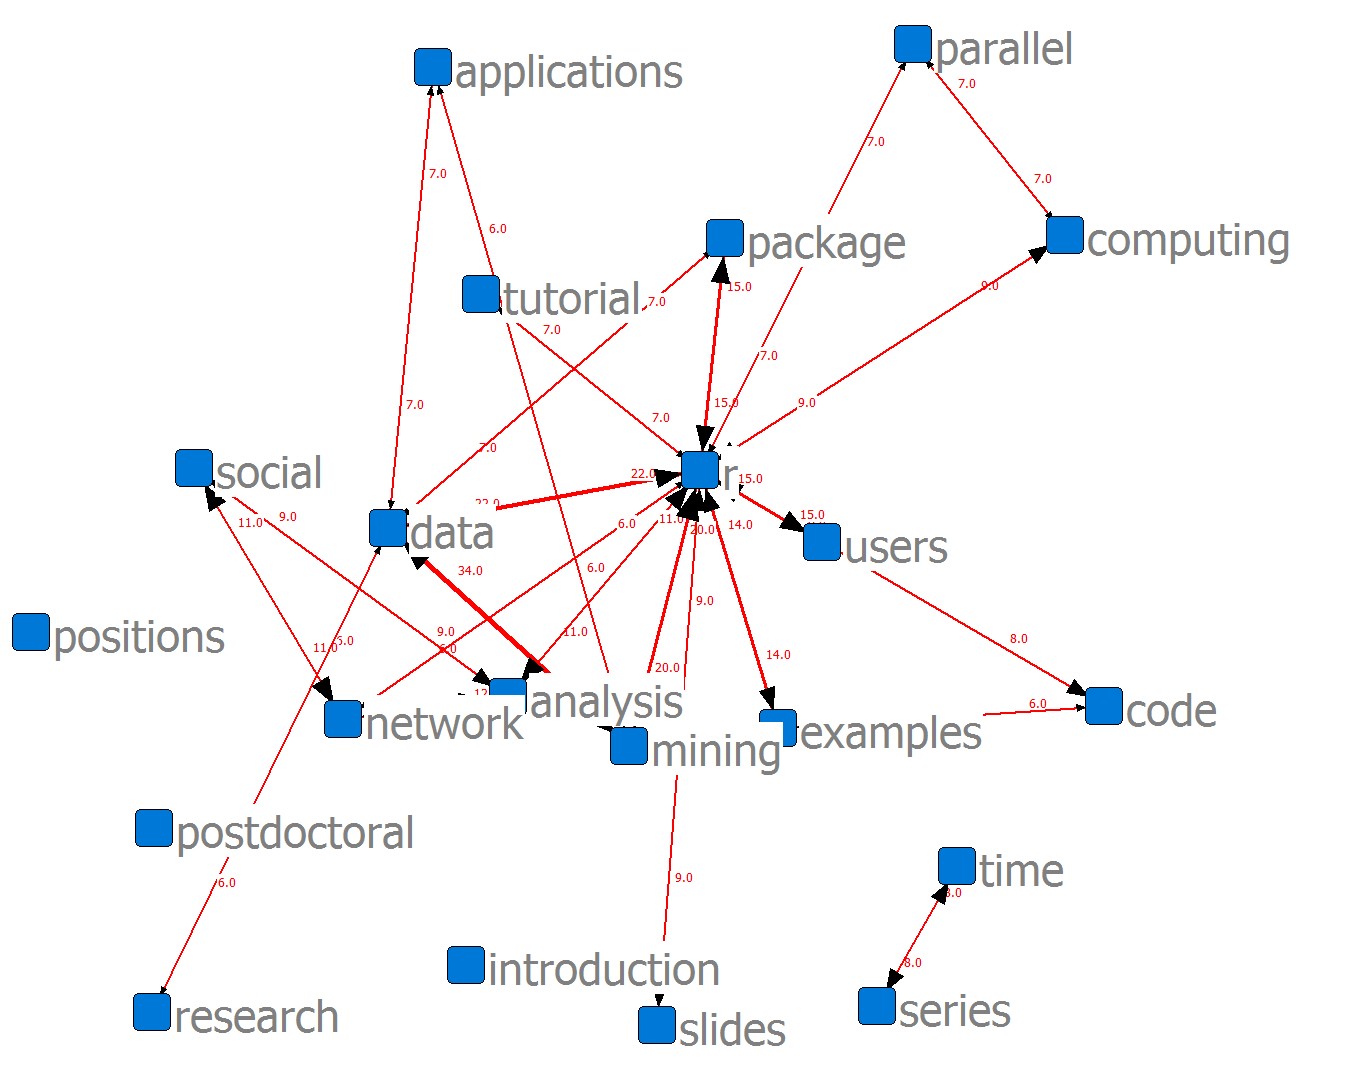
Two mode → one mode data by termMatrix = termDocmatrix * transposed(termDocmatrix)
- termMatrix data = one mode matrix data showing the relationships among the words (appeared in the Doc)
- For example, the word, “data” appears in the doc a toal of “53”
- And, In a total of “5” cases, both data and examples appeared at the same time(document).
- Therefore, the word, “mining(34)” is more close (relevant) to “data” than “examples(5)”
Next we can build a graph with graph.adjacency() from package igraph.
library(igraph)
# build a graph from the above matrix
g <- graph.adjacency(termMatrix, weighted=T, mode = “undirected”)
# remove loops
g <- simplify(g)
# set labels and degrees of vertices
V(g)$label <- V(g)$name
V(g)$degree <- degree(g)
V(g)$label
V(g)$degree
> library(igraph)
> g <- graph.adjacency(termMatrix, weighted=T, mode = "undirected")
> g <- simplify(g)
> V(g)$label <- V(g)$name
> V(g)$degree <- degree(g)
> V(g)$degree
 [1] 17  6  9  9 18 14 12 20 14 13  8  7  8 17  9 11 15 11 11 16 15
> V(g)$label
 [1] "analysis"     "applications" "code"         "computing"
 [5] "data"         "examples"     "introduction" "mining"
 [9] "network"      "package"      "parallel"     "positions"
[13] "postdoctoral" "r"            "research"     "series"
[17] "slides"       "social"       "time"         "tutorial"
[21] "users"
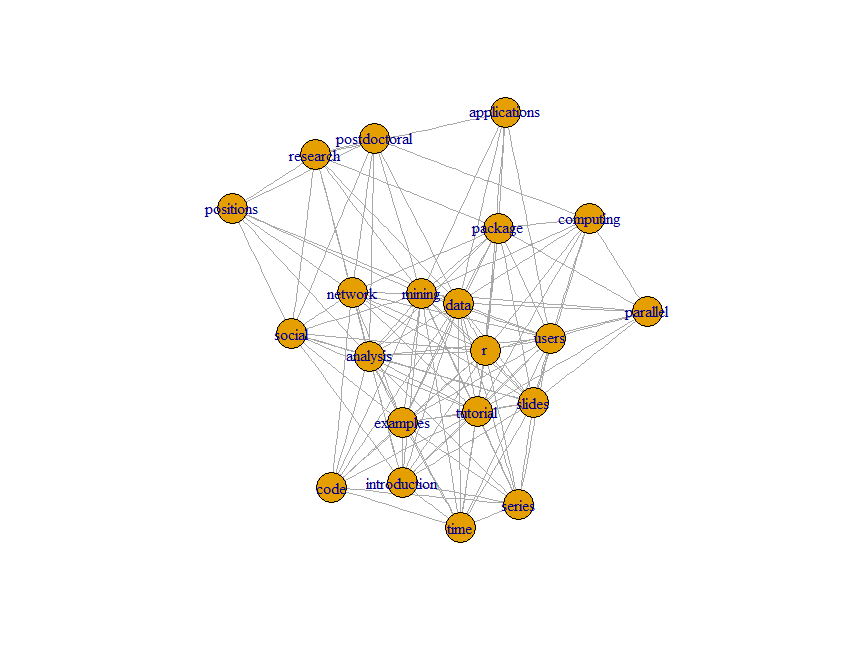
Plot a Graph
# set seed to make the layout reproducible
set.seed(3952)
layout1 <- layout.fruchterman.reingold(g)
plot(g, layout=layout1)
> # set seed to make the layout reproducible
> set.seed(3952)
> layout1 <- layout.fruchterman.reingold(g)
> plot(g, layout=layout1)
Different layout of plot
plot(g, layout=layout.kamada.kawai)
tkplot(g, layout=layout.kamada.kawai)
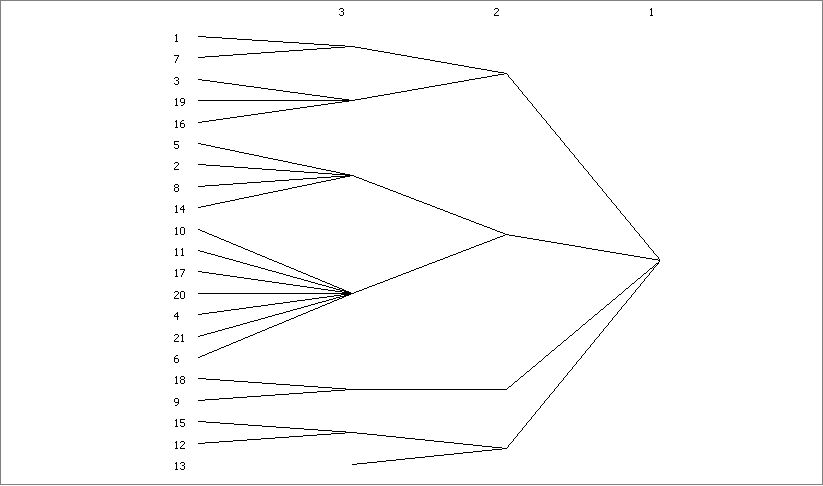
CONCOR
--------------------------------------------------------------------------------

Diagonal:                               Ignore
Max partitions:                         3
Input dataset:                          terms (D:\Users\Hyo\Documents\UCINET data\rdm\terms)

Initial Correlation Matrix

                      1     2     3     4     5     6     7     8     9    10    11    12    13    14    15    16    17    18    19    20    21
                  analy appli  code compu  data examp intro minin netwo packa paral posit postd     r resea serie slide socia  time tutor users
                  ----- ----- ----- ----- ----- ----- ----- ----- ----- ----- ----- ----- ----- ----- ----- ----- ----- ----- ----- ----- -----
  1     analysis   1.00  0.19  0.49  0.22  0.18  0.51  0.73  0.23  0.75  0.43  0.13  0.13  0.10  0.07  0.02  0.26  0.59  0.71  0.26  0.73  0.47
  2 applications   0.19  1.00  0.36  0.28  0.97  0.56  0.38  0.98 -0.14  0.68  0.26  0.38  0.50  0.72  0.50  0.17  0.63 -0.16  0.17  0.55  0.51
  3         code   0.49  0.36  1.00  0.45  0.53  0.92  0.47  0.38  0.13  0.67  0.35 -0.22 -0.17  0.40 -0.22  0.55  0.67  0.05  0.55  0.62  0.75
  4    computing   0.22  0.28  0.45  1.00  0.35  0.56  0.03  0.32  0.03  0.76  0.97 -0.22 -0.27  0.20 -0.19  0.16  0.61 -0.11  0.16  0.44  0.71
  5         data   0.18  0.97  0.53  0.35  1.00  0.56  0.28  0.94 -0.00  0.64  0.30 -0.00  0.29  0.54  0.18  0.28  0.59 -0.06  0.28  0.49  0.60
  6     examples   0.51  0.56  0.92  0.56  0.56  1.00  0.47  0.60  0.26  0.83  0.47 -0.11 -0.07  0.68 -0.10  0.54  0.85  0.11  0.54  0.76  0.84
  7 introduction   0.73  0.38  0.47  0.03  0.28  0.47  1.00  0.37  0.48  0.42 -0.01  0.07  0.17  0.52 -0.01  0.41  0.67  0.36  0.41  0.68  0.48
  8       mining   0.23  0.98  0.38  0.32  0.94  0.60  0.37  1.00 -0.05  0.71  0.28  0.41  0.31  0.67  0.51  0.19  0.62 -0.13  0.19  0.52  0.54
  9      network   0.75 -0.14  0.13  0.03 -0.00  0.26  0.48 -0.05  1.00  0.14 -0.03  0.13  0.21 -0.09 -0.01  0.15  0.24  0.92  0.15  0.39  0.25
 10      package   0.43  0.68  0.67  0.76  0.64  0.83  0.42  0.71  0.14  1.00  0.68 -0.01  0.02  0.84  0.03  0.32  0.88 -0.02  0.32  0.77  0.91
 11     parallel   0.13  0.26  0.35  0.97  0.30  0.47 -0.01  0.28 -0.03  0.68  1.00 -0.28 -0.21  0.32 -0.23  0.10  0.54 -0.16  0.10  0.43  0.65
 12    positions   0.13  0.38 -0.22 -0.22 -0.00 -0.11  0.07  0.41  0.13 -0.01 -0.28  1.00  0.90 -0.00  0.94 -0.26 -0.06  0.30 -0.26  0.01 -0.21
 13 postdoctoral   0.10  0.50 -0.17 -0.27  0.29 -0.07  0.17  0.31  0.21  0.02 -0.21  0.90  1.00  0.15  0.87 -0.19  0.01  0.28 -0.19  0.09 -0.15
 14            r   0.07  0.72  0.40  0.20  0.54  0.68  0.52  0.67 -0.09  0.84  0.32 -0.00  0.15  1.00  0.13  0.22  0.72 -0.16  0.22  0.74  0.80
 15     research   0.02  0.50 -0.22 -0.19  0.18 -0.10 -0.01  0.51 -0.01  0.03 -0.23  0.94  0.87  0.13  1.00 -0.30 -0.06  0.05 -0.30 -0.01 -0.18
 16       series   0.26  0.17  0.55  0.16  0.28  0.54  0.41  0.19  0.15  0.32  0.10 -0.26 -0.19  0.22 -0.30  1.00  0.55  0.01  1.00  0.33  0.49
 17       slides   0.59  0.63  0.67  0.61  0.59  0.85  0.67  0.62  0.24  0.88  0.54 -0.06  0.01  0.72 -0.06  0.55  1.00  0.14  0.55  0.81  0.92
 18       social   0.71 -0.16  0.05 -0.11 -0.06  0.11  0.36 -0.13  0.92 -0.02 -0.16  0.30  0.28 -0.16  0.05  0.01  0.14  1.00  0.01  0.41  0.12
 19         time   0.26  0.17  0.55  0.16  0.28  0.54  0.41  0.19  0.15  0.32  0.10 -0.26 -0.19  0.22 -0.30  1.00  0.55  0.01  1.00  0.33  0.49
 20     tutorial   0.73  0.55  0.62  0.44  0.49  0.76  0.68  0.52  0.39  0.77  0.43  0.01  0.09  0.74 -0.01  0.33  0.81  0.41  0.33  1.00  0.80
 21        users   0.47  0.51  0.75  0.71  0.60  0.84  0.48  0.54  0.25  0.91  0.65 -0.21 -0.15  0.80 -0.18  0.49  0.92  0.12  0.49  0.80  1.00


PARTITION DIAGRAM

          i         a                           p
          n         p                           o
          t         p             c           p s
        a r         l       p   t o   e     r o t
        n o         i     p a   u m   x   n e s d
        a d     s   c m   a r s t p   a s e s i o
        l u     e   a i   c a l o u u m o t e t c
        y c c t r d t n   k l i r t s p c w a i t
        s t o i i a i i   a l d i i e l i o r o o
        i i d m e t o n   g e e a n r e a r c n r
        s o e e s a n g r e l s l g s s l k h s a

              1 1       1 1 1 1 2   2   1   1 1 1
Level   1 7 3 9 6 5 2 8 4 0 1 7 0 4 1 6 8 9 5 2 3
-----   - - - - - - - - - - - - - - - - - - - - -
    3   XXX XXXXX XXXXXXX XXXXXXXXXXXXX XXX XXX .
    2   XXXXXXXXX XXXXXXXXXXXXXXXXXXXXX XXX XXXXX
    1   XXXXXXXXXXXXXXXXXXXXXXXXXXXXXXX XXXXXXXXX


Relation Sheet 1
Blocked Matrix

                    1  7    3 19 16    5  2  8 14   10 11 17 20  4 21  6   18  9   15 12   13
                   an in   co ti se   da ap mi  r   pa pa sl tu co us ex   so ne   re po   po
                  ----------------------------------------------------------------------------
  1     analysis | 23  2 |  1  4  4 |  4     4 11 |  2     3  4     5  4 |  9 12 |  1  2 |  3 |
  7 introduction |  2 10 |     1  1 |  2     2  2 |        2  1     2  2 |  2  2 |       |    |
                 ------------------------------------------------------------------------------
  3         code |  1    |  9  2  2 |  1     3  8 |           1        6 |     1 |       |    |
 19         time |  4  1 |  2  8  8 |  1     3  5 |        2  1     2  2 |       |       |    |
 16       series |  4  1 |  2  8  8 |  1     3  5 |        2  1     2  2 |       |       |    |
                 ------------------------------------------------------------------------------
  5         data |  4  2 |  1  1  1 | 53  7 34 22 |  7  1  4  4  1  4  5 |       |  6  5 |  5 |
  2 applications |       |          |  7  9  6  4 |  1              1    |       |  1    |    |
  8       mining |  4  2 |  3  3  3 | 34  6 47 20 |  5  1  4  4  1  5  5 |  1  1 |  2  1 |  4 |
 14            r | 11  2 |  8  5  5 | 22  4 20 70 | 15  7  9  7  9 15 14 |  3  6 |       |    |
                 ------------------------------------------------------------------------------
 10      package |  2    |          |  7  1  5 15 | 21  3  1  4  2  5  2 |     1 |  1    |    |
 11     parallel |       |          |  1     1  7 |  3  8  1  1  7  2    |       |       |    |
 17       slides |  3  2 |     2  2 |  4     4  9 |  1  1 16  1  1  4  1 |  1  2 |       |    |
 20     tutorial |  4  1 |  1  1  1 |  4     4  7 |  4  1  1 16  1  3  3 |  2  5 |       |    |
  4    computing |       |          |  1     1  9 |  2  7  1  1 10  2    |       |       |  1 |
 21        users |  5  2 |     2  2 |  4  1  5 15 |  5  2  4  3  2 18  3 |     2 |       |    |
  6     examples |  4  2 |  6  2  2 |  5     5 14 |  2     1  3     3 17 |  1  2 |       |    |
                 ------------------------------------------------------------------------------
 18       social |  9  2 |          |        1  3 |        1  2        1 | 12 11 |  2  2 |  3 |
  9      network | 12  2 |  1       |        1  6 |  1     2  5     2  2 | 11 17 |  1  2 |  2 |
                 ------------------------------------------------------------------------------
 15     research |  1    |          |  6  1  2    |  1                   |  2  1 | 12  4 |  4 |
 12    positions |  2    |          |  5     1    |                      |  2  2 |  4 11 |  4 |
                 ------------------------------------------------------------------------------
 13 postdoctoral |  3    |          |  5     4    |              1       |  3  2 |  4  4 | 11 |
                  -----------------------------------------------------------------------------


Density Matrix

             1      2      3      4      5      6      7
        ------ ------ ------ ------ ------ ------ ------
    1    2.000  1.833  3.125  1.786  6.250  0.750  1.500
    2    1.833  4.000  2.500  1.000  0.167  0.000  0.000
    3    3.125  2.500 15.500  4.607  1.375  1.875  2.250
    4    1.786  1.000  4.607  2.238  1.143  0.071  0.143
    5    6.250  0.167  1.375  1.143 11.000  1.750  2.500
    6    0.750  0.000  1.875  0.071  1.750  4.000  4.000
    7    1.500  0.000  2.250  0.143  2.500  4.000

R-squared = 0.474

First order actor-by-actor correlation matrix saved as dataset Concor1stCorr
Partition-by-actor indicator matrix saved as dataset ConcorCCPart
Permutation vector saved as dataset ConcorCCPerm

----------------------------------------
Running time:  00:00:01
Output generated:  08 12 16 09:32:55
UCINET 6.614 Copyright (c) 1992-2016 Analytic Technologies
E.g. Dan McFarland's students data
data file
# Load the 'igraph' library
library('igraph')

# (1) Read in the data files, NA data objects coded as 'na'
magact96 = read.delim('http://commres.net/wiki/_media/mag_act96.txt', na.strings = 'na')
magact97 = read.delim('http://commres.net/wiki/_media/mag_act97.txt', na.strings = 'na')
magact98 = read.delim('http://commres.net/wiki/_media/mag_act98.txt', na.strings = 'na')
Variables:
- ID, gender(GND), grade(GRD), race(RCE)
- Clubs attended by the ID (1 if so, 0 if not so): Asian.Club, Hispanic.Club, . . . .
magattrib = magact96[,1:4]

g96 <- as.matrix(magact96[,-(1:4)]); row.names(g96) = magact96$ID.
g97 <- as.matrix(magact97[,-(1:4)]); row.names(g97) = magact97$ID.
g98 <- as.matrix(magact98[,-(1:4)]); row.names(g98) = magact98$ID.
i96 <- graph.incidence(g96, mode=c('all') )
i97 <- graph.incidence(g97, mode=c('all') )
i98 <- graph.incidence(g98, mode=c('all') )
V(i96)$color[1:1295] <- rgb(1,0,0,.5)
V(i96)$color[1296:1386] <- rgb(0,1,0,.5)
V(i96)$label <- V(i96)$name
V(i96)$label.color <- rgb(0,0,.2,.5)
V(i96)$label.cex <- .4
V(i96)$size <- 6
V(i96)$frame.color <- NA
E(i96)$color <- rgb(.5,.5,0,.2)
pdf('i96.pdf')
plot(i96, layout=layout.fruchterman.reingold)
dev.off()
i96 <- delete.vertices(i96, V(i96)[ degree(i96)==0 ])
V(i96)$label[1:857] <- NA
V(i96)$color[1:857] <-  rgb(1,0,0,.1)
V(i96)$size[1:857] <- 2

E(i96)$width <- .3
E(i96)$color <- rgb(.5,.5,0,.1)

pdf('i96.2.pdf')
plot(i96, layout=layout.kamada.kawai)
dev.off()

pdf('i96.3.pdf')
plot(i96, layout=layout.fruchterman.reingold.grid)
dev.off()

pdf('i96.4.pdf')
plot(i96, layout=layout.fruchterman.reingold)
dev.off()
g96e <- t(g96) %*% g96
g97e <- t(g97) %*% g97
g98e <- t(g98) %*% g98

i96e <- graph.adjacency(g96e, mode = 'undirected')
E(i96e)$weight <- count.multiple(i96e)
i96e <- simplify(i96e)
# Set vertex attributes
V(i96e)$label <- V(i96e)$name
V(i96e)$label.color <- rgb(0,0,.2,.8)
V(i96e)$label.cex <- .6
V(i96e)$size <- 6
V(i96e)$frame.color <- NA
V(i96e)$color <- rgb(0,0,1,.5)

# Set edge gamma according to edge weight
egam <- (log(E(i96e)$weight)+.3)/max(log(E(i96e)$weight)+.3)
E(i96e)$color <- rgb(.5,.5,0,egam)
pdf('i96e.pdf')
plot(i96e, main = 'layout.kamada.kawai', layout=layout.kamada.kawai)
plot(i96e, main = 'layout.fruchterman.reingold', layout=layout.fruchterman.reingold)
dev.off()
Group overlap networks and plots
ol96 <- g96e/diag(g96e)
ol97 <- g97e/diag(g97e)
ol98 <- g98e/diag(g98e)
magall <- ol96 + ol97 + ol98
magall[is.na(magall)] <- 0
magdiag <- apply(cbind(diag(g96e), diag(g97e), diag(g98e)), 1, mean )
magallg <- graph.adjacency(magall, weighted=T)

# Degree
V(magallg)$degree <- degree(magallg)

# Betweenness centrality
V(magallg)$btwcnt <- betweenness(magallg)
plot(density(magall))
magallgt1 <- magall
magallgt1[magallgt1 < 1] <- 0
magallggt1 <- graph.adjacency(magallgt1, weighted=T)

# Removes loops:
magallggt1 <- simplify(magallggt1, remove.multiple=FALSE, remove.loops=TRUE)
magallggt1$layout <- layout.fruchterman.reingold(magallggt1)
V(magallggt1)$label <- V(magallggt1)$name
tkplot(magallggt1)
magallggt1$layout <- tkplot.getcoords(1)
# Set vertex attributes
V(magallggt1)$label <- V(magallggt1)$name
V(magallggt1)$label.color <- rgb(0,0,.2,.6)
V(magallggt1)$size <- 6
V(magallggt1)$frame.color <- NA
V(magallggt1)$color <- rgb(0,0,1,.5)

# Set edge attributes
E(magallggt1)$arrow.size <- .3

# Set edge gamma according to edge weight
egam <- (E(magallggt1)$weight+.1)/max(E(magallggt1)$weight+.1)
E(magallggt1)$color <- rgb(.5,.5,0,egam)
V(magallggt1)$label.cex <- V(magallggt1)$degree/(max(V(magallggt1)$degree)/2)+ .3
#note, unfortunately one must play with the formula above to get the
#ratio just right
pdf('magallggt1customlayout.pdf')
plot(magallggt1)
dev.off()
text_mining.1510615916.txt.gz · Last modified: by hkimscil


