This is an old revision of the document!
Table of Contents
Poisson Distribution
$$X \sim Po(\lambda)$$
단위 시간, 단위 공간에 어떤 사건이 몇 번 발생할 것인가를 표현하는 이산 확률분포
모수(population parameter).
- 단위시간 또는 단위공간에서 평균발생횟수
- lambda (λ)로 표시
- 한 시간 동안 은행에 다녀간 고객의 수
- 한 시간 동안 사무실에 걸려온 전화의 수
- 어떤 책의 한 페이지에 존재하는 오타의 수
- 팝콘 기계가 일주일 동안 고장나는 횟수
조건
- 개별 사건이 주어진 구간에 임의로 그리고 독립적으로 발생
- 일주일 동안
- 1마일마다 등 시간이나 공간
- 해당 구간에서 사건이 발생하는 수의 평균값이나 비율을 알고 있음 (lambda($\lambda$))
$$ P(X=r) = e^{- \lambda} \dfrac{\lambda^{r}} {r!},\qquad k = 0, 1, 2, . . ., $$
For curiosity,
\begin{eqnarray*}
\sum_{r=0}^{\infty} e^{- \lambda} \dfrac{\lambda^{r}} {r!}
& = & e^{- \lambda} \sum_{r=0}^{\infty} \dfrac{\lambda^{r}} {r!} \\
& = & e^{- \lambda} \left(1 + \lambda + \dfrac{\lambda^{2}}{2!} + \dfrac{\lambda^{3}}{3!} + . . . \right) \\
& = & e^{- \lambda}e^{\lambda} \\
& = & 1
\end{eqnarray*}
왜 $e^{\lambda} = \left(1 + \lambda + \dfrac{\lambda^{2}}{2!} + \dfrac{\lambda^{3}}{3!} + . . . \right)$ 인지는 Taylor series 문서를 참조.
이것이 의미하는 것은 r이 0에서 무한대로 갈 때의 확률값의 분포를 말하므로 전체 분포가 1이 됨을 의미한다. 아래 “What does the Poisson distribution look like?” 참조
> e <- exp(1)
> e
[1] 2.718282

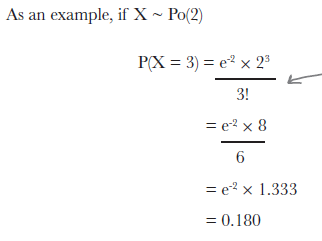
위의 그림은 lambda는 2, 즉 한달에 아주대학교 앞의 건널목 주변 찻길에서 교통사고가 날 횟수가 2회라고 할 때, X=3 이므로 3번 교통사고가 일어날 확률을 (P(X=3)) 묻는 문제이다.
\begin{eqnarray*}
P(X = 3) & = & e^{-2} * \frac {2^{3}}{3!} \\
& = & 0.180
\end{eqnarray*}
What does the Poisson distribution look like?
\begin{eqnarray*} P(X=r) = e^{- \lambda} \dfrac{\lambda^{r}} {r!},\qquad r = 0, 1, 2, . . ., \end{eqnarray*}
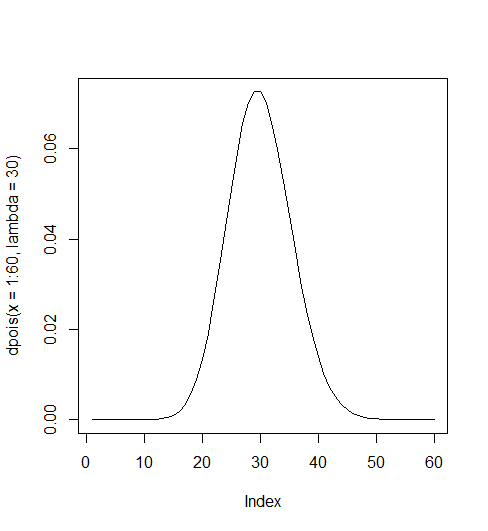
마포 신한은행 지점에 시간당 은행에 방문하는 손님의 숫자: lambda = 30
> dpois(x=1:60, lambda=30)
 [1] 2.807287e-12 4.210930e-11 4.210930e-10 3.158198e-09 1.894919e-08
 [6] 9.474593e-08 4.060540e-07 1.522702e-06 5.075675e-06 1.522702e-05
[11] 4.152825e-05 1.038206e-04 2.395861e-04 5.133987e-04 1.026797e-03
[16] 1.925245e-03 3.397491e-03 5.662486e-03 8.940767e-03 1.341115e-02
[21] 1.915879e-02 2.612562e-02 3.407689e-02 4.259611e-02 5.111534e-02
[26] 5.897924e-02 6.553248e-02 7.021338e-02 7.263453e-02 7.263453e-02
[31] 7.029148e-02 6.589826e-02 5.990751e-02 5.285957e-02 4.530820e-02
[36] 3.775683e-02 3.061365e-02 2.416867e-02 1.859128e-02 1.394346e-02
[41] 1.020253e-02 7.287524e-03 5.084319e-03 3.466581e-03 2.311054e-03
[46] 1.507209e-03 9.620485e-04 6.012803e-04 3.681308e-04 2.208785e-04
[51] 1.299285e-04 7.495876e-05 4.242949e-05 2.357194e-05 1.285742e-05
[56] 6.887904e-06 3.625212e-06 1.875110e-06 9.534457e-07 4.767229e-07
> plot(dpois(x=1:60, lambda=30), type = "l")
>
위에서 언급한
\begin{eqnarray*} \sum_{r=0}^{\infty} e^{- \lambda} \dfrac{\lambda^{r}} {r!} & = & e^{- \lambda} \sum_{r=0}^{\infty} \dfrac{\lambda^{r}} {r!} \\ & = & e^{- \lambda} \left(1 + \lambda + \dfrac{\lambda^{2}}{2!} + \dfrac{\lambda^{3}}{3!} + . . . \right) \\ & = & e^{- \lambda}e^{\lambda} \\ & = & 1 \end{eqnarray*}
에서 1 이란 이야기는 아래 그림의 그래프가 전체가 1이 됨을 의미함. 즉 위에서는 1부터 60까지 갔지만, 1부터 무한대로 하면 완전한 분포곡선이 되는데 이것이 1이라는 뜻 (가령 dpois(x=1:1000, lambda=30)과 같은 케이스).
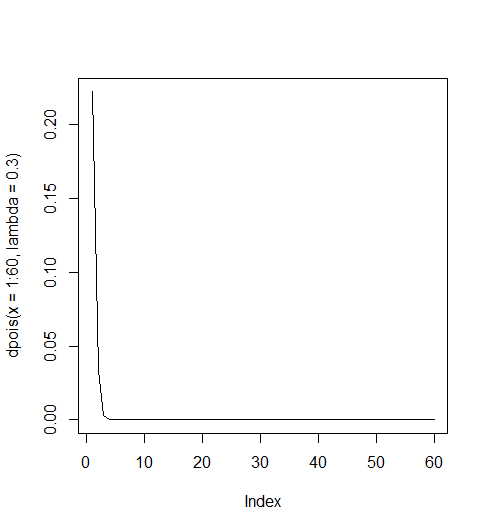
lambda가 클 수록 좌우대칭의 종형분포를 이루고 1), 작을 수록 오른 쪽으로 편향된 (skewed to the right) 혹은 양의방향으로 편향된(positively skewed) 분포를 2) 이룬다.
> dpois(x=1:60, lambda=.3)
 [1]  2.222455e-01  3.333682e-02  3.333682e-03  2.500261e-04  1.500157e-05
 [6]  7.500784e-07  3.214622e-08  1.205483e-09  4.018277e-11  1.205483e-12
[11]  3.287682e-14  8.219204e-16  1.896739e-17  4.064441e-19  8.128883e-21
[16]  1.524166e-22  2.689704e-24  4.482840e-26  7.078168e-28  1.061725e-29
[21]  1.516750e-31  2.068296e-33  2.697777e-35  3.372222e-37  4.046666e-39
[26]  4.669230e-41  5.188033e-43  5.558607e-45  5.750283e-47  5.750283e-49
[31]  5.564790e-51  5.216991e-53  4.742719e-55  4.184752e-57  3.586930e-59
[36]  2.989108e-61  2.423601e-63  1.913370e-65  1.471823e-67  1.103867e-69
[41]  8.077076e-72  5.769340e-74  4.025121e-76  2.744401e-78  1.829600e-80
[46]  1.193218e-82  7.616283e-85  4.760177e-87  2.914394e-89  1.748636e-91
[51]  1.028610e-93  5.934286e-96  3.359030e-98 1.866128e-100 1.017888e-102
[56] 5.452971e-105 2.869985e-107 1.484475e-109 7.548177e-112 3.774089e-114
> plot(dpois(x=1:60, lambda=.3), type = "l")
>
일반적으로 lambda가 1보다 작으면 geometric distribution 형태의 그래프를, 1보다 크면 정규분포 형태의 모양을 갖는다.
Exercise
Your job is to play like you’re the popcorn machine and say what the probability is of you malfunctioning a particular number of times next week. Remember, the mean number of times you break down in a week is 3.4.
- What’s the probability of the machine not malfunctioning next week?
- What’s the probability of the machine malfunctioning three times next week?
- What’s the expectation and variance of the machine malfunctions?
1. What’s the probability of the machine not malfunctioning next week?
$\lambda = 3.4$
$\text{malfunctioning} = 0$
\begin{eqnarray*} P(X=0) & = & e^{-3.4} * \frac{3.4^{0}} {0!} \\ & = & e^{-3.4} \\ & = & 0.03337327 \end{eqnarray*}
# R 에서 계산
> e^(-3.4)
[1] 0.03337327
>
# 혹은
> dpois(0, 3.4)
[1] 0.03337327
>
포아송 분포를 따르는 확률에서 아무것도 일어나지 않을 때의 확률은 e-lambda 가 된다. 예를 들면 119 전화가 한시간에 걸려오는 확률이 5번이라고 할 때, 지난 한 시간동안 한 건의 전화도 없을 확률은?
\begin{eqnarray*}
P(X=0) & = & e^{-5} * \frac{5^{0}} {0!} \\
& = & e^{-5} \\
& = & 0.006737947
\end{eqnarray*}
> lamba <- 5
> e <- exp(1)
> px.0 <- e^(-lamba)
>
> px.0
[1] 0.006737947
>
# or
> dpois(0,5)
[1] 0.006737947
2. What’s the probability of the machine malfunctioning three times next week?
l <- 3.4
x <- 3
e <- exp(1)
ans <- ((e^(-l))*l^x)/factorial(x)
> l <- 3.4
> x <- 3
> e <- exp(1)
> ans <- ((e^(-l))*l^x)/factorial(x)
>
> ans
[1] 0.2186172
>
위의 계산 대신 아래와 같은 function을 이용하는 것이 보통이다.
> dpois(x=3, lambda=3.4)
[1] 0.2186172
마찬가지로 적어도 3번까지 고장나는 경우는 0, 1, 2, 3을 포함하므로
> sum(dpois(c(0:3), lambda=3.4))
[1] 0.5583571
>
3. What’s the expectation and variance of the machine malfunctions?
\begin{eqnarray*}
E(X) & = & \lambda \\
Var(X) & = & \lambda \\
& = & 3.4
\end{eqnarray*}
Two Poisson distribution cases
\begin{eqnarray*} X \sim Po(3.4) \\ Y \sim Po(2.3) \end{eqnarray*}
위의 조건일 때, Popcorn 기계와 coffee 기계가 한 주일 동안 고장나지 않을 확률을 구하려면 아래를 말한다.
\begin{eqnarray*}
P(X + Y = 0)
\end{eqnarray*}
여기서 X + Y의 분포는 아래와 같다.
\begin{eqnarray*}
X + Y \sim (\lambda_{x} + \lambda_{y})
\end{eqnarray*}
lambda의 합은 5.7이고 (아래 참조), 결국 lambda가 5.7일 때 X=0의 확률(probability)를 구하는 문제이므로 0.003
\begin{eqnarray*}
\lambda_{X} + \lambda_{Y} & = & 3.4 + 2.3 \\
& = & 5.7 \\
\end{eqnarray*}
$$X + Y \sim Po(5.7)$$
\begin{eqnarray*} P(X + Y = 0) & = & \frac {e^{- \lambda} \lambda^{r}} {r!} \\ & = & \frac {e^{-5.7} 5.7^{0}}{0!} \\ & = & e^{-5.7} \\ & = & 0.003 \end{eqnarray*}
Broken Cookies case
The Case of the Broken Cookies
Kate works at the Statsville cookie factory, and her job is to make sure that boxes of cookies meet the factory’s strict rules on quality control. Kate know that the probability that a cookie is broken is 0.1, and her boss has asked her to find the probability that there will be 15 broken cookies in a box of 100 cookies. “It’s easy,” he says. “Just use the binomial distribution where n is 100, and p is 0.1.”
Kate picks up her calculator, but when she tries to calculate 100!, her calculator displays an error because the number is too big. “Well,” says her boss, “you’ll just have to calculate it manually. But I’m going home now, so have a nice night.”
Kate stares at her calculator, wondering what to do. Then she smiles. “Maybe I can leave early tonight, after all.”
Within a minute, Kate’s calculated the probability. She’s managed to find the probability and has managed to avoid calculating 100! altogether. She picks up her coat and walks out the door.
How did Kate find the probability so quickly, and avoid the error on her calculator?
우선 위의 문제를 binomial distribution 문제로 생각하면 답은
\begin{eqnarray*}
P(r=15) & = & _{100}C_{15} * 0.1^{15} * 0.99^{85}\\
\end{eqnarray*}
라고 볼 수 있다.
\begin{eqnarray} X & \sim & B(n, p) \\ X & \sim & Po(\lambda) \end{eqnarray}
Poisson distribution을 대신 사용할 수 있으려면, B(n, p)와 Po(lambda)가 유사해야 한다. 두 distribution의 기대값과 분산값을 살펴보면,
- B(n, p)의 경우 E(X) = np
- Po(lambda)의 경우 E(X) = lambda 이고
- Var(X) = npq 이고
- Var(lambda) = lambda 이다.
따라서, 둘의 성격이 비슷하기 위해서는 npq 와 np가 같아야 한다. 따라서 q는 1이어야 하는데, 현실적으로 1일 수는 없으므로 1에 가깞고, n이 충분히 크다면 둘의 성격이 비슷해질 수 있다고 판단한다. 따라서,
- 만약 n이 충분히 크고
- p가 작으면 (q가 크면)
- $X \sim B(n, p)$와 $Y \sim Po(np)$는 비슷할 것이다.
- 보통은 n > 50인 경우, p = 0.1 보다 작은 경우가 위에 해당한다.
> dbinom(x=15, 100, 0.1)
[1] 0.03268244
> choose(100, 15)
[1] 2.533385e+17
> a <- choose(100, 15)
> b <- .1^15
> c <- .9^85
> a*b*c
[1] 0.03268244
>
위가 답이긴 하지만 limited calculator 로는
x ~ b (n, p)이고
b(100, 0.1)이므로
n*p = 10 = lambda
따라서 Pois 분포로 보는 답은
lambda = 10 일때 P(r=15)값을 구하는 문제로
\begin{eqnarray*} P(r = 15) & = & e^{-10} * \frac {10^{15}}{15!} \\ & = & 0.0347180 \end{eqnarray*}
> dpois(x=15, lambda=10)
[1] 0.03471807
>
A student needs to take an exam, but hasn’t done any revision for it. He needs to guess the answer to each question, and the probability of getting a question right is 0.05. There are 50 questions on the exam paper. What’s the probability he’ll get 5 questions right? Use the Poisson approximation to the binomial distribution to find out.
만약에 binomial distribution 으로 계산을 한다면
> dbinom(x=5, 50, 0.05)
[1] 0.06584064
>
Poisson distribution을 이용하라고 한다. . .
$ X \sim B(50, 0.05) $ 일 때, $P(X=5)$를 구하는 것. 이 때의 기대값 E(X)는 $ E(X) = np = 50 * .05 = 2.5 $ 이므로 위의 문제는
\begin{eqnarray*} X & \sim & Po(\lambda) \\ X & \sim & Po(2.5) \end{eqnarray*}
일 때, $P(X=5)$를 구하는 것과 같다.
> dpois(x=5, lambda = 2.5)
[1] 0.06680094
>
수식을 따르면,
\begin{eqnarray*}
P(X = 5) & = & \frac {e^{-2.5} * 2.5^{5}}{5!} \\
& = & 0.067
\end{eqnarray*}
> n <- 50
> p <- .05
> q <- 1-p
> x <- 5
> np <- n*p
# Poisson distribution
> e <- exp(1)
> lambda <- np
> lambda
[1] 2.5
> a <- e^(-lambda)
> b <- lambda^x
> c <- factorial(x)
> a*b/c
[1] 0.06680094
>
Exercise
Here are some scenarios. Your job is to say which distribution each of them follows, say what the expectation and variance are, and find any required probabilities.
1. A man is bowling. The probability of him knocking all the pins over is 0.3. If he has 10 shots, what’s the probability he’ll knock all the pins over less than three times?
Binomial distribution 을 이용한다면,
\begin{eqnarray*}
X & \sim & B(n, p) \\
X & \sim & B(10, 0.3)
\end{eqnarray*}
\begin{eqnarray*} E(X) & = & np \\ & = & 10 * 0.3 \\ & = & 3 \end{eqnarray*}
\begin{eqnarray*} Var(X) & = & npq \\ & = & 10 * 0.3 * 0.7 \\ & = & 2.1 \end{eqnarray*}
r을 이용한다면 pbinom 을 이용한다.
> pbinom(q=2, 10, 0.3)
[1] 0.3827828
>
손으로 계산을 한다고 하면,
$P(X=0), P(X=1), P(X=2)$를 구한 후 모두 더하여 P(X < 3)을 구한다.
\begin{eqnarray*} P(X = 0) & = & {10 \choose 0} * 0.3^0 * 0.7^10 \\ & = & 1 * 1 * 0.028 \\ & = & 0.028 \end{eqnarray*}
\begin{eqnarray*} P(X = 1) & = & {10 \choose 1} *0.3^1 * 0.7^9 \\ & = & 10 * 0.3 * 0.04035 \\ & = & 0.121 \end{eqnarray*}
\begin{eqnarray*} P(X = 2) & = & {10 \choose 2} * 0.3^2 * 0.7^8 \\ & = & 45 * 0.09 * 0.0576 \\ & = & 0.233 \end{eqnarray*}
\begin{eqnarray*} P(X<3) & = & P(X=0) + P(X=1) + P(X=2) \\ & = & 0.028 + 0.121 + 0.233 \\ & = & 0.382 \end{eqnarray*}
2. On average, 1 bus stops at a certain point every 15 minutes. What’s the probability that no buses will turn up in a single 15 minute interval?
위는 Poisson distribution 문제이므로 기대값과 분산값은 각각 lambda 값인 1 (15분마다 1대씩 버스가 온다고 한다)
\begin{eqnarray*} P(X=0) & = & \frac {e^{-1}{1^0}}{0!} \\ & = & \frac {e^-1 * 1}{1} \\ & = & .368 \end{eqnarray*}
3. 20% of cereal packets contain a free toy. What’s the probability you’ll need to open fewer than 4 cereal packets before finding your first toy?
이는 geometric distribution 문제이므로,
$$X \sim Geo(.2)$$
$P(X \le 3)$ 을 구하는 문제이므로
\begin{eqnarray*} P(X \le 3) & = & 1 - q^r \\ & = & 1 - 0.8^{3} \\ & = & 1 - 0.512 \\ & = & 0.488 \end{eqnarray*}
기대값과 분산은 각각 $1/p$, $q/p^2$ 이므로 $5$와 $20$.


