b:head_first_statistics:visualization
Table of Contents
정보의 시각화: 첫인상
Charts
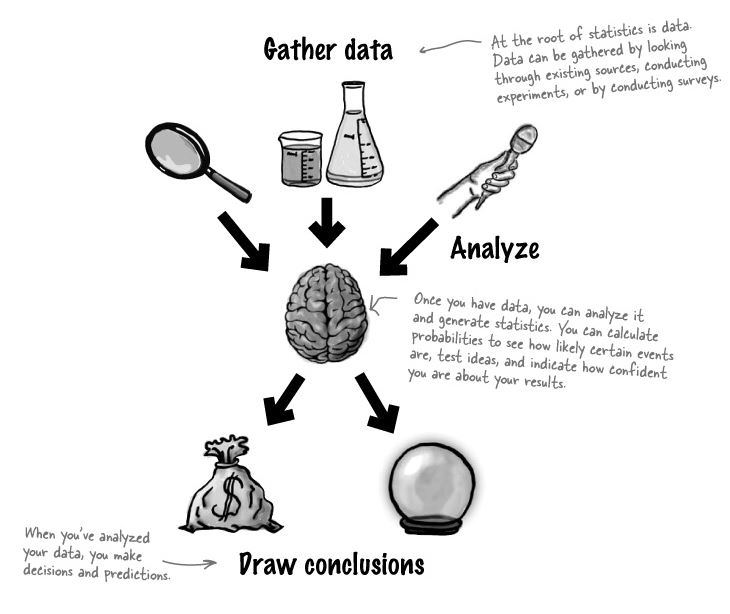
- 모은 데이터를 분석하는 한 방법
- 상황을 파악하고 결론을 내려 결정을 (decision making) 할 수 있도록 한다.
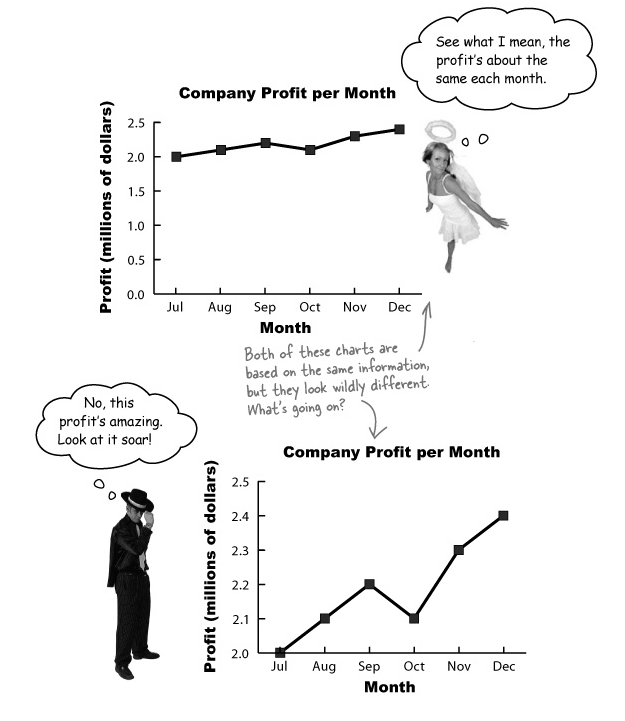
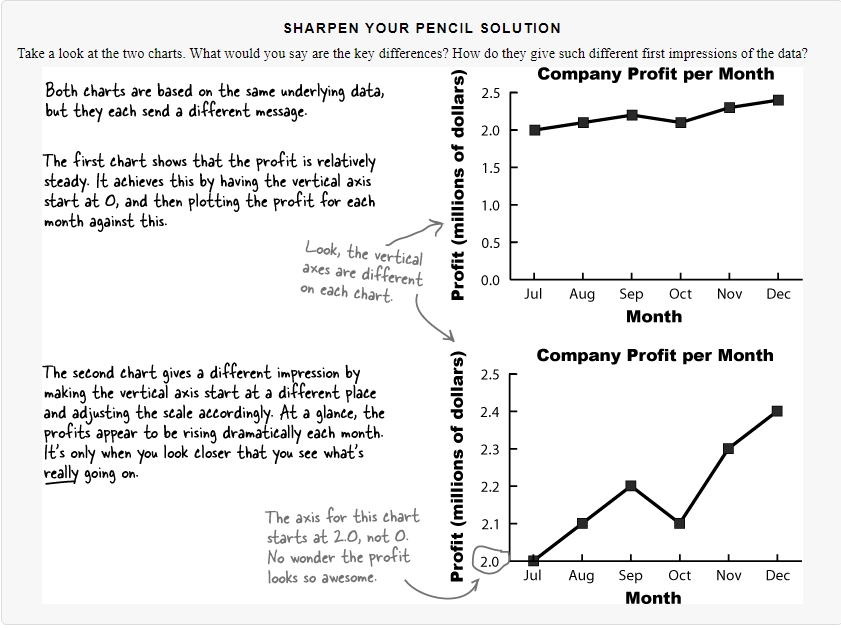
- 그러나, 데이터의 시각화에는 많은 허점이 따른다.
- the same data
- different axis
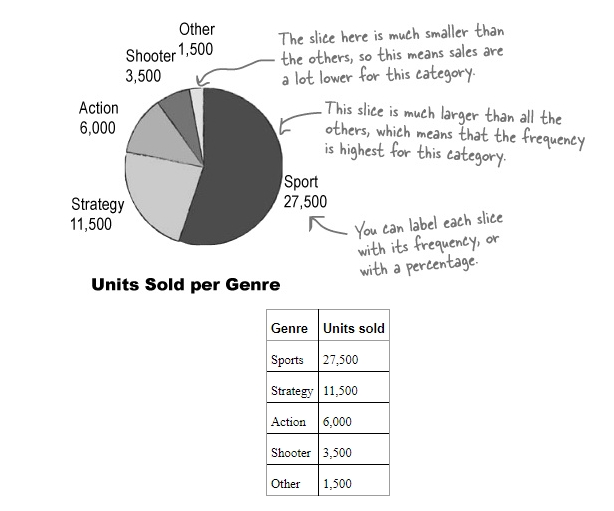
Pie Chart
Good to go with
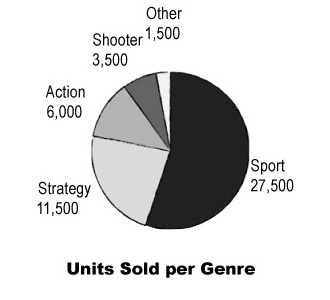
- frequency data for categories which should add up to 100 percent
- side note for actual numbers and
- table
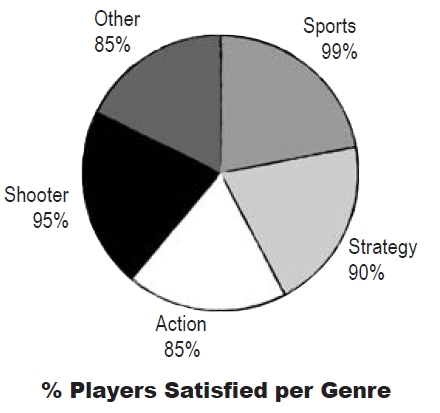
- 각 게임 장르별 사용자의 만족도 퍼센티지를 모아 놓은 파이차트는 유용하지 않다.
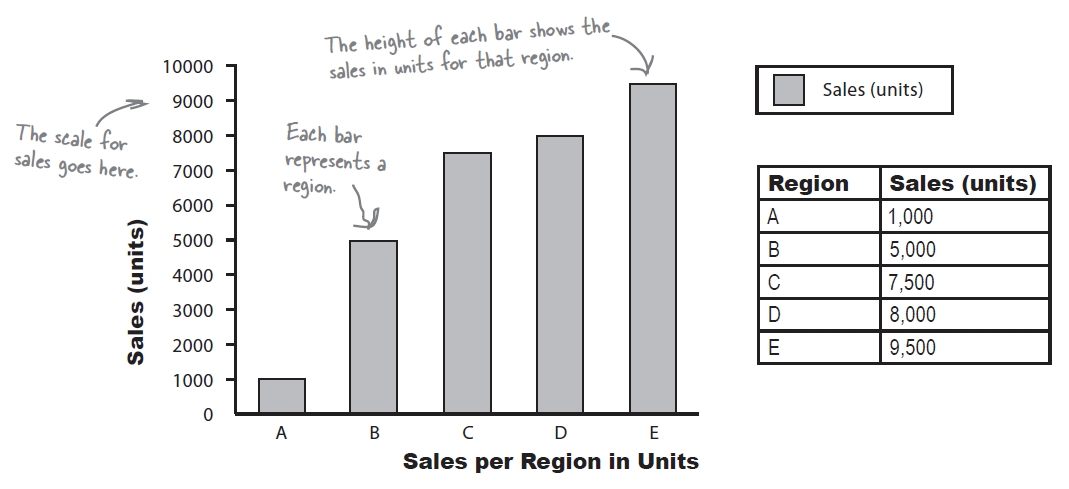
Bar chart
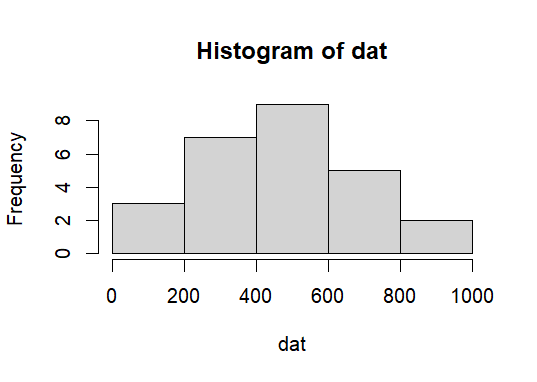
Histogram
| ser | freq |
|---|---|
| 1 | 100 |
| 2 | 88 |
| 3 | 159 |
| 4 | 201 |
| 5 | 250 |
| 6 | 250 |
| 7 | 254 |
| 8 | 288 |
| 9 | 356 |
| 10 | 380 |
| 11 | 430 |
| 12 | 450 |
| 13 | 433 |
| 14 | 543 |
| 15 | 540 |
| 16 | 570 |
| 17 | 450 |
| 18 | 433 |
| 19 | 543 |
| 20 | 690 |
| 21 | 640 |
| 22 | 720 |
| 23 | 777 |
| 24 | 720 |
| 25 | 880 |
| 26 | 900 |
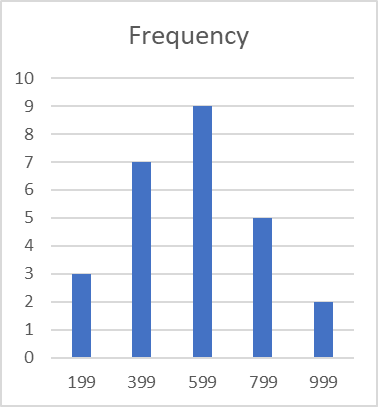
Excel에서의 histogram
| Bin | Frequency |
| 199 | 3 |
| 399 | 7 |
| 599 | 9 |
| 799 | 5 |
| 999 | 2 |
in R . . . .
dat <- c(100, 88, 159, 201, 250, 250, 254, 288, 356, 380,
         430, 450, 433, 543, 540, 570, 450, 433, 543, 690,
         640, 720, 777, 720, 880, 900)
dat
hist(dat)
hist(dat, breaks=5)
dat.iq <- rnorm(1000, 100, 15)
head(dat.iq)
tail(dat.iq)
head(dat.iq, n=12)
tail(dat.iq, n=12)

mean(dat.iq)
sd(dat.iq)

hist(dat.iq)
hist(dat.iq, breaks=30, col='lightblue')

set.seed(101)
dat.iq <- rnorm(1000, 100, 15)
head(dat.iq)
tail(dat.iq)
head(dat.iq, n=12)
tail(dat.iq, n=12)

mean(dat.iq)
sd(dat.iq)

hist(dat.iq)
hist(dat.iq, breaks=30, col='lightblue')
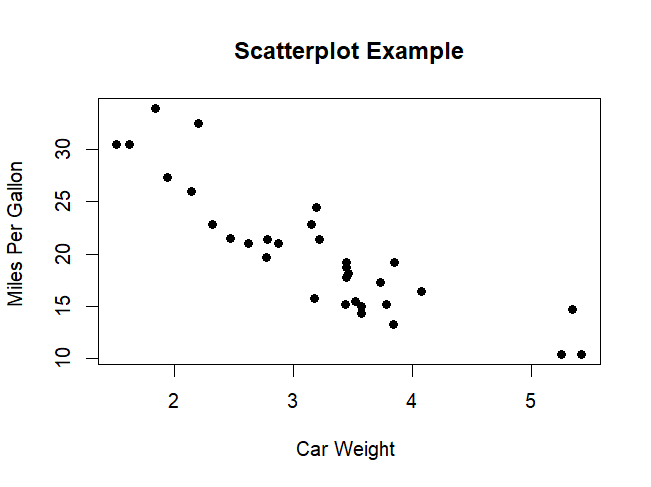
Scatter plot
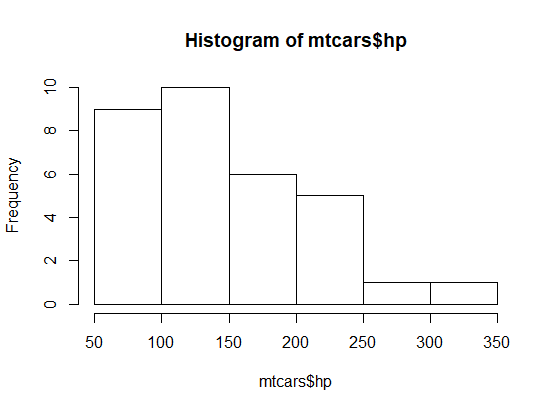
hist(mtcars$hp)

                     mpg cyl  disp  hp drat    wt  qsec vs am gear carb
Mazda RX4           21.0   6 160.0 110 3.90 2.620 16.46  0  1    4    4
Mazda RX4 Wag       21.0   6 160.0 110 3.90 2.875 17.02  0  1    4    4
Datsun 710          22.8   4 108.0  93 3.85 2.320 18.61  1  1    4    1
Hornet 4 Drive      21.4   6 258.0 110 3.08 3.215 19.44  1  0    3    1
Hornet Sportabout   18.7   8 360.0 175 3.15 3.440 17.02  0  0    3    2
Valiant             18.1   6 225.0 105 2.76 3.460 20.22  1  0    3    1
Duster 360          14.3   8 360.0 245 3.21 3.570 15.84  0  0    3    4
Merc 240D           24.4   4 146.7  62 3.69 3.190 20.00  1  0    4    2
Merc 230            22.8   4 140.8  95 3.92 3.150 22.90  1  0    4    2
Merc 280            19.2   6 167.6 123 3.92 3.440 18.30  1  0    4    4
Merc 280C           17.8   6 167.6 123 3.92 3.440 18.90  1  0    4    4
Merc 450SE          16.4   8 275.8 180 3.07 4.070 17.40  0  0    3    3
Merc 450SL          17.3   8 275.8 180 3.07 3.730 17.60  0  0    3    3
Merc 450SLC         15.2   8 275.8 180 3.07 3.780 18.00  0  0    3    3
Cadillac Fleetwood  10.4   8 472.0 205 2.93 5.250 17.98  0  0    3    4
Lincoln Continental 10.4   8 460.0 215 3.00 5.424 17.82  0  0    3    4
Chrysler Imperial   14.7   8 440.0 230 3.23 5.345 17.42  0  0    3    4
Fiat 128            32.4   4  78.7  66 4.08 2.200 19.47  1  1    4    1
Honda Civic         30.4   4  75.7  52 4.93 1.615 18.52  1  1    4    2
Toyota Corolla      33.9   4  71.1  65 4.22 1.835 19.90  1  1    4    1
Toyota Corona       21.5   4 120.1  97 3.70 2.465 20.01  1  0    3    1
Dodge Challenger    15.5   8 318.0 150 2.76 3.520 16.87  0  0    3    2
AMC Javelin         15.2   8 304.0 150 3.15 3.435 17.30  0  0    3    2
Camaro Z28          13.3   8 350.0 245 3.73 3.840 15.41  0  0    3    4
Pontiac Firebird    19.2   8 400.0 175 3.08 3.845 17.05  0  0    3    2
Fiat X1-9           27.3   4  79.0  66 4.08 1.935 18.90  1  1    4    1
Porsche 914-2       26.0   4 120.3  91 4.43 2.140 16.70  0  1    5    2
Lotus Europa        30.4   4  95.1 113 3.77 1.513 16.90  1  1    5    2
Ford Pantera L      15.8   8 351.0 264 4.22 3.170 14.50  0  1    5    4
Ferrari Dino        19.7   6 145.0 175 3.62 2.770 15.50  0  1    5    6
Maserati Bora       15.0   8 301.0 335 3.54 3.570 14.60  0  1    5    8
Volvo 142E          21.4   4 121.0 109 4.11 2.780 18.60  1  1    4    2
# Simple Scatterplot
attach(mtcars)
plot(wt, mpg, main="Scatterplot Example",
   xlab="Car Weight ", ylab="Miles Per Gallon ",
   pch=19)
explanatory (설명) variable at x axis
response (반응) at y axis
But, it does mean no causal relationship between the two variables. Association between two does not guarantee a causal relationship.
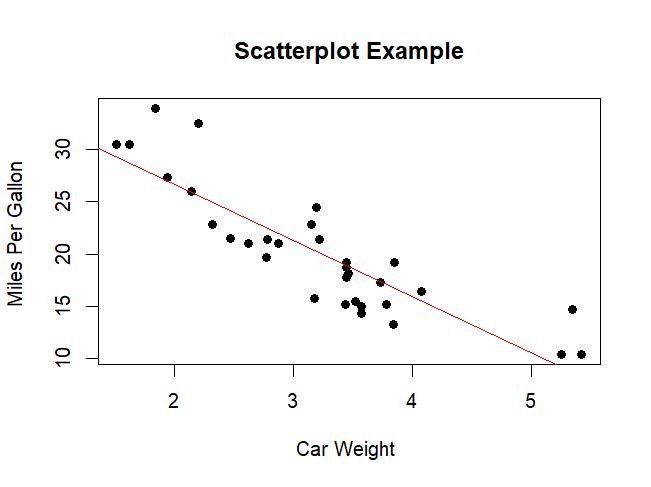
Drawing a line among the data.
# Add fit lines
abline(lm(mpg~wt), col="red") # regression line (y~x)
Outlier에 대한 주의
Presentation
For a very good example, see
https://www.gapminder.org/answers/how-does-income-relate-to-life-expectancy/
- Life expectancy data: life.exp.csv
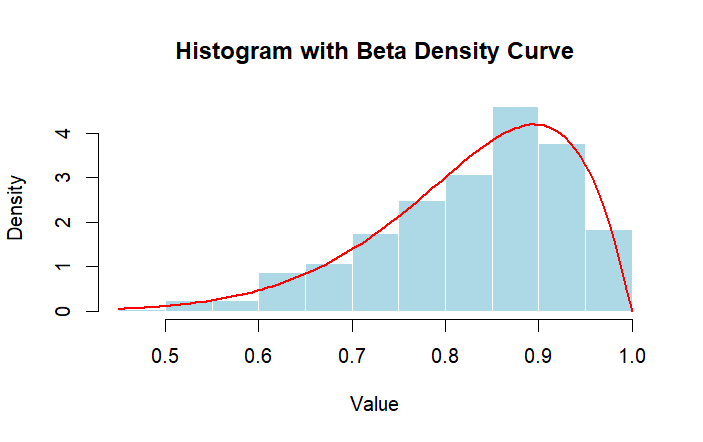
Histogram skewedness
####
# left-skewed distribution
# 1.
set.seed(1)
data <- rbeta(500, shape1 = 10, shape2 = 2)
hist(data, probability = TRUE,
     main = "Histogram with Left-skewed data",
     xlab = "Value", ylab = "Density",
     col = "lightblue", border = "white")

# 2.
# install.packages("fitdistrplus")
library(fitdistrplus)

fit <- fitdist(data, "beta")
alpha_est <- fit$estimate["shape1"]
beta_est <- fit$estimate["shape2"]

# 3.
curve(dbeta(x, shape1 = alpha_est, shape2 = beta_est),
      add = TRUE, col = "red", lwd = 2)
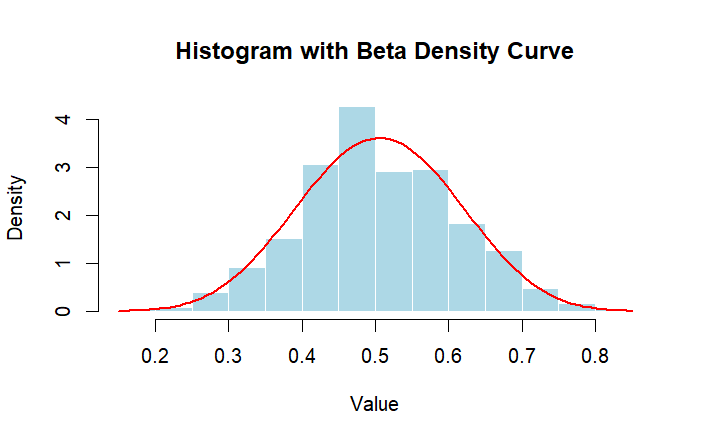
set.seed(1)
data <- rbeta(500, shape1 = 10, shape2 = 10)
hist(data, probability = TRUE,
     main = "Histogram with Normal Distribution Data",
     xlab = "Value", ylab = "Density",
     col = "lightblue", border = "white")

# 2.
# install.packages("fitdistrplus")
library(fitdistrplus)

fit <- fitdist(data, "beta")
alpha_est <- fit$estimate["shape1"]
beta_est <- fit$estimate["shape2"]

# 3.
curve(dbeta(x, shape1 = alpha_est, shape2 = beta_est),
      add = TRUE, col = "red", lwd = 2)
##
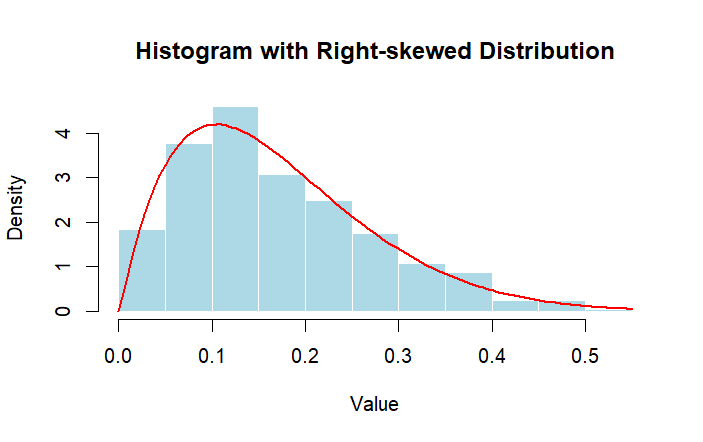
# right-skewed distribution
# 1.
set.seed(1)
data <- rbeta(500, shape1 = 2, shape2 = 10)
hist(data, probability = TRUE,
     main = "Histogram with Right-skewed Distribution",
     xlab = "Value", ylab = "Density",
     col = "lightblue", border = "white")

# install.packages("fitdistrplus")
library(fitdistrplus)

fit <- fitdist(data, "beta")
alpha_est <- fit$estimate["shape1"]
beta_est <- fit$estimate["shape2"]

#
curve(dbeta(x, shape1 = alpha_est, shape2 = beta_est),
      add = TRUE, col = "red", lwd = 2)
Histogram Modality
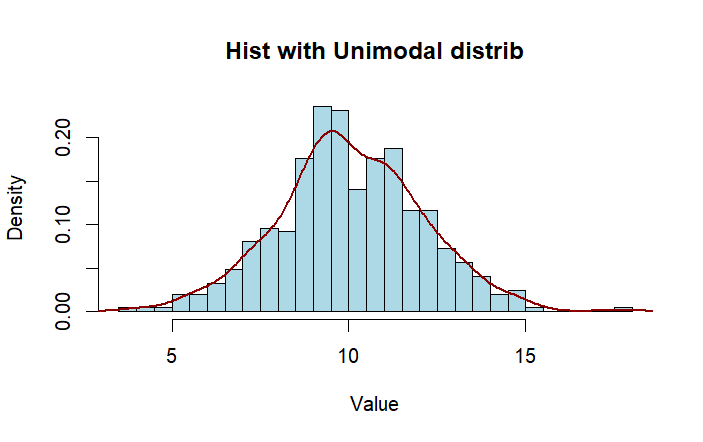
Unimodal
### unimodal data
set.seed(1)
d.1 <- rnorm(500, 10, 2)
hist(d.1, breaks = 30, probability = T,
     main = "Hist with Unimodal distrib",
     xlab = "Value", ylab = "Density",
     col = "lightblue", border = "black")
lines(density(d.1),
      col = "darkred", lwd = 2)
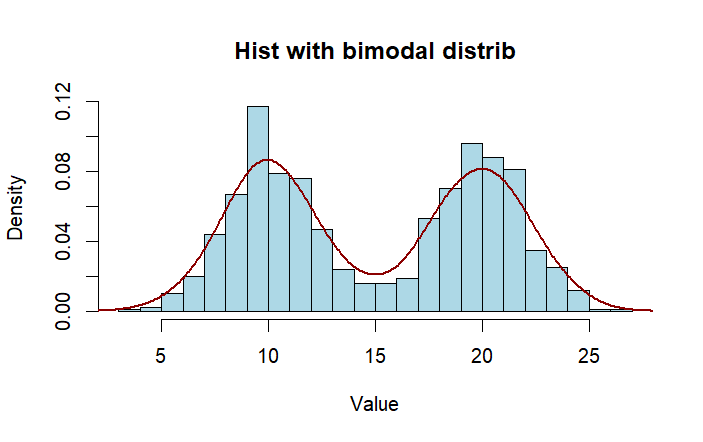
Bimodal distribution
### bimodal data
set.seed(1)
d.1 <- rnorm(500, 10, 2)
d.2 <- rnorm(500, 20, 2)
d.all <- c(d.1, d.2)
hist(d.all, breaks = 30, probability = T,
     main = "Hist with bimodal distrib",
     xlab = "Value", ylab = "Density",
     col = "lightblue", border = "black")
lines(density(d.all),
      col = "darkred", lwd = 2)
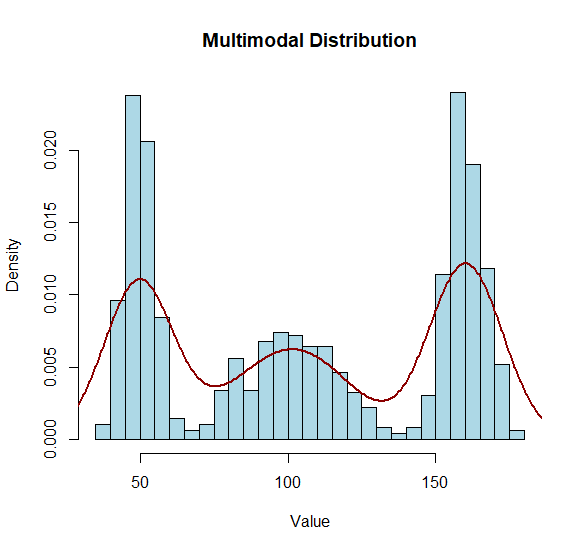
### multi-modal data
# Parameters for the first normal distribution (Mode 1)
m.1 <- 50
sd.1 <- 5

# Parameters for the second normal distribution (Mode 2)
m.2 <- 100
sd.2 <- 15

m.3 <- 160
sd.3 <- 6

# Mixing proportion for Mode 1
prop.1 <- 0.3
# Mixing proportion for Mode 2
prop.2 <- 0.6 # This is 1 - prop1
# Mixing proportion for Mode 2
prop.3 <- 1.0 # This is 1 - prop1

# Number of samples to generate
n.sam <- 1000

# Create an empty vector to store the combined samples

mm.dist <- numeric(n.sam)
set.seed(1)
for (i in 1:n.sam) {
  # Randomly choose which distribution to sample from
  tmp <- runif(1)
  if (tmp < prop.1) {
    mm.dist[i] <- rnorm(1, mean = m.1, sd = sd.1)
  } else if (tmp < prop.2) {
    mm.dist[i] <- rnorm(1, mean = m.2, sd = sd.2)
  } else {
    mm.dist[i] <- rnorm(1, mean = m.3, sd = sd.3)
  }

}

hist(mm.dist, breaks = 30,
     main = "Multimodal Distribution",
     xlab = "Value", ylab = "Density",
     freq = FALSE, probability = T,
     col = "lightblue", border = "black")
lines(density(mm.dist),
      col = "darkred", lwd = 2)
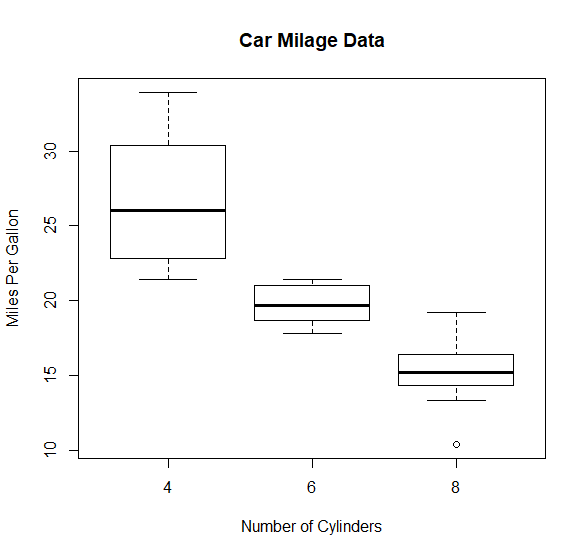
box plot
# Boxplot of MPG by Car Cylinders
boxplot(mpg~cyl,data=mtcars,
    main="Car Milage Data",
    xlab="Number of Cylinders",
    ylab="Miles Per Gallon")
see also
b/head_first_statistics/visualization.txt · Last modified: by hkimscil

