This is an old revision of the document!
Table of Contents
You should read correlation, regression, multiple regression, and deriviation of a and b in a simple regression as well.
Covariance
Variance and Covariance
\begin{eqnarray}
\text{Var (X, X)} & = & \displaystyle \frac {SS}{df} \nonumber \\
& = & \displaystyle \frac {\sum{(\text{error})^2}}{n-1} \nonumber \\
& = & \displaystyle \frac {\sum_{i=1}^{n} {(X_i-\overline{X}}) (X_i-\overline{X}) } {n-1} \\
\text{Cov (X, Y)} & = & \displaystyle \frac {SP}{df} \nonumber \\
& = & \displaystyle \frac {\sum{(\text{product of errors from each mean})}}{n-1} \nonumber \\
& = & \displaystyle \frac {\sum_{i=1}^{n} {(X_i-\overline{X}}) (Y_i-\overline{Y}) } {n-1} \\
\end{eqnarray}
Note that
- covariance value can be negative.
- covariance value can be affected by the measurement unit
- e.g. Y = 억단위 투자금 vs Y = 원단위 투자금
- 큰 의미 없이 covariance 값이 달라진다.
- 이를 해결하기 위해서
- covariance value / each x and y unit measurement (sd)
Correlation
\begin{eqnarray} \text{correlation, r} & = & \frac {\text{Cov (X,Y)}} {sd(X) * sd(Y)} \\ & = & \frac {\text{SP (X,Y)} }{ \sqrt{\text{SS.x}*\text{SS.y}}} \nonumber \end{eqnarray}
F-test (anova)
for reminding
\begin{eqnarray*}
\text{F} & = & \frac {\text{MS}_\text{between group}} {\text{MS}_\text{within group}} \\
& = & \frac {\text{Difference due to the treatment (IV) } }{ \text{Difference due to random error} } \\
& = & \frac {\text{Error explained by IV } }{ \text{Error remain random} } \\
& = & \frac {\text{(독립변인에 의해) 설명된오차로 구성된 분산 } }{ \text{나머지오차로 구성된 분산 } } \\
\end{eqnarray*}
\begin{eqnarray*} \text{R}^\text{2} & = & \frac {\text{SS}_\text{between group}} {\text{SS}_\text{total, y}} \\ \end{eqnarray*}
Check in R
# data prep
rnorm2 <- function(n,mean,sd){ mean+sd*scale(rnorm(n)) }
set.seed(191)
n.x <- 40
m.x <- 100
s.x <- 10
x <- rnorm2(n.x, m.x, s.x)
x

# y has a linear relationship with x
a <- 2
b <- -10
n.y <- n.x
re <- rnorm(n.y, 0, 20)
y <- (a*x) + b + re
y
cov(x,y)
sd(x)
sd(y)
cov(x,y)/(sd(x)*sd(y))
cor(x,y)

n.x
df.x <- n.x-1
df.y <- df.x
sp.xy <- cov(x,y) * df.x
ss.x <- var(x) * df.x
ss.y <- var(y) * df.y
sp.xy/sqrt(ss.x*ss.y)
cor(x,y)
>
> # data prep
> rnorm2 <- function(n,mean,sd){ mean+sd*scale(rnorm(n)) }
> set.seed(191)
> n.x <- 40
> m.x <- 100
> s.x <- 10
> x <- rnorm2(n.x, m.x, s.x)
> x
           [,1]
 [1,]  99.35817
 [2,] 107.72169
 [3,] 111.04574
 [4,] 100.65968
 [5,] 103.85350
 [6,] 122.91296
 [7,] 102.07927
 [8,]  96.92756
 [9,] 115.96195
[10,]  94.24901
[11,]  97.30033
[12,] 110.23739
[13,] 114.73077
[14,] 102.28326
[15,] 112.89297
[16,]  96.12475
[17,] 100.23641
[18,]  88.18567
[19,]  94.75283
[20,] 110.71928
[21,] 105.81396
[22,]  99.89274
[23,] 104.14215
[24,] 103.82149
[25,]  97.85588
[26,] 104.26732
[27,]  90.79210
[28,]  86.64193
[29,]  91.08626
[30,]  77.77150
[31,] 116.52461
[32,]  99.52034
[33,]  85.34661
[34,]  96.14854
[35,] 100.53925
[36,]  95.45190
[37,]  77.35589
[38,] 100.05830
[39,]  92.06457
[40,]  92.67148
attr(,"scaled:center")
[1] -0.08680858
attr(,"scaled:scale")
[1] 1.039345
>
> # y has a linear relationship with x
> a <- 2
> b <- -10
> n.y <- n.x
> re <- rnorm(n.y, 0, 20)
> y <- (a*x) + b + re
> y
          [,1]
 [1,] 175.7367
 [2,] 200.0202
 [3,] 241.0439
 [4,] 166.0401
 [5,] 195.5682
 [6,] 210.8411
 [7,] 181.9459
 [8,] 193.8544
 [9,] 225.4417
[10,] 182.5276
[11,] 194.5656
[12,] 232.4421
[13,] 255.3070
[14,] 209.0313
[15,] 219.1602
[16,] 181.7819
[17,] 214.3124
[18,] 187.2961
[19,] 207.3581
[20,] 235.0318
[21,] 199.2244
[22,] 208.1031
[23,] 182.2575
[24,] 201.4683
[25,] 169.6124
[26,] 173.7941
[27,] 161.0332
[28,] 152.1292
[29,] 153.4874
[30,] 147.7652
[31,] 189.2685
[32,] 188.5691
[33,] 155.5620
[34,] 172.8731
[35,] 184.9119
[36,] 183.3182
[37,] 119.8266
[38,] 162.6349
[39,] 170.0872
[40,] 150.7684
attr(,"scaled:center")
[1] -0.08680858
attr(,"scaled:scale")
[1] 1.039345
> cov(x,y)
         [,1]
[1,] 222.3867
> sd(x)
[1] 10
> sd(y)
[1] 28.35979
> cov(x,y)/(sd(x)*sd(y))
          [,1]
[1,] 0.7841619
> cor(x,y)
          [,1]
[1,] 0.7841619
>
> n.x
[1] 40
> df.x <- n.x-1
> df.y <- df.x
> sp.xy <- cov(x,y) * df.x
> ss.x <- var(x) * df.x
> ss.y <- var(y) * df.y
> sp.xy/sqrt(ss.x*ss.y)
          [,1]
[1,] 0.7841619
> cor(x,y)
          [,1]
[1,] 0.7841619
>
>
code
rnorm2 <- function(n,mean,sd){ mean+sd*scale(rnorm(n)) }
set.seed(191)
n.x <- 40
m.x <- 100
s.x <- 10
x <- rnorm2(n.x, m.x, s.x)
x
ss.x <- sum((m.x - x)^2)
df.x <- n.x - 1
ss.x/df.x
var(x)

# linear relationship
a <- 2
b <- -10
n.y <- n.x
re <- rnorm(n.y, 0, 20)
y <- (a*x) + b + re
y
m.y <- mean(y)
df.y <- n.y - 1
ss.y <- sum((y-m.y)^2)
ss.y/df.y
var(y)

prod <- (x-m.x)*(y-m.y)
sp <- sum(prod)
sp/df.y
cov(x,y)

s.x <- sd(x)
s.y <- sd(y)
(sp/df.y)/(s.x*s.y)
cor(x,y)

df.y
df.x

sqrt(ss.x/df.x) # s.x 값이 이것
sd(x)
sqrt(ss.y/df.y) # s.y 값이 이것
sd(y)

cov(x,y)/(s.x*s.y)
(sp/df.y)/sqrt((ss.x/df.x)*(ss.y/df.y))
sp/sqrt(ss.x*ss.y) # 분모 분자에서 n-1을 제거하고 보면
cor(x,y)

# graph with ggplot2
df <- data.frame(x,y)
library(ggplot2)
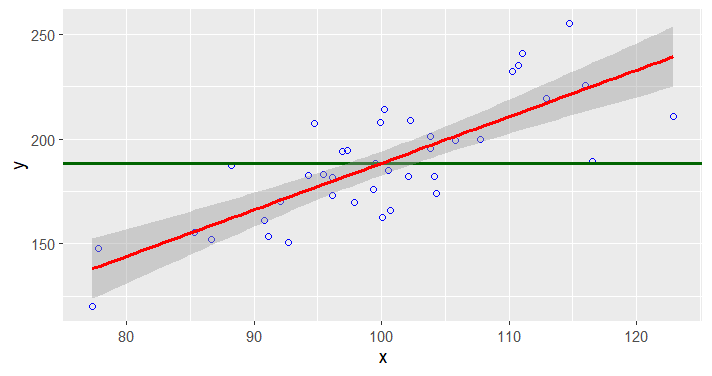
ggplot(data=df, aes(x,y)) +
  geom_point(color="blue", size=1.5, pch=1.5) +
  geom_hline(aes(yintercept=mean(y)), size=1, color="darkgreen") +
  stat_smooth(method = "lm",
              formula = y ~ x,
              geom = "smooth", color="red", size=1)

# note that the red line is y.hat = a + bx,
# where error value y.hat - y is minimized
# how to derive a and b
# how to derive coefficient values
# see wiki doc at
# http://commres.net/wiki/deriviation_of_a_and_b_in_a_simple_regression
lm.df <- lm(y~x, data = df)
summary(lm.df)
a <- summary(lm.df)$coefficients[1]
b <- summary(lm.df)$coefficients[2]
a
b
# y = a + b*x 에서
b2 <- sp/ss.x
b3 <- cov(x,y)/var(x,x)
# m.y = a + (b*m.x) 이므로
a2 <- m.y - (b2*m.x)

b3
b2
b

a2
a

#
# reg, res, total error
#
y.hat <- (a+(b*x))
y.hat2 <- predict(lm.df)
y.hat == y.hat2
y
y.hat
m.y

tmp <- data.frame(y, y.hat, m.y)
tmp
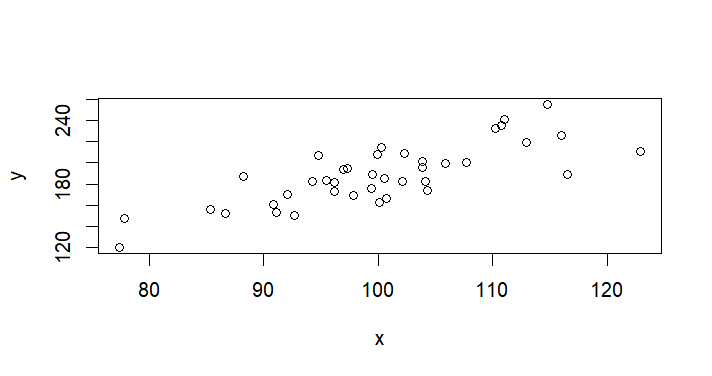
plot(x,y) # 원래 데이터터
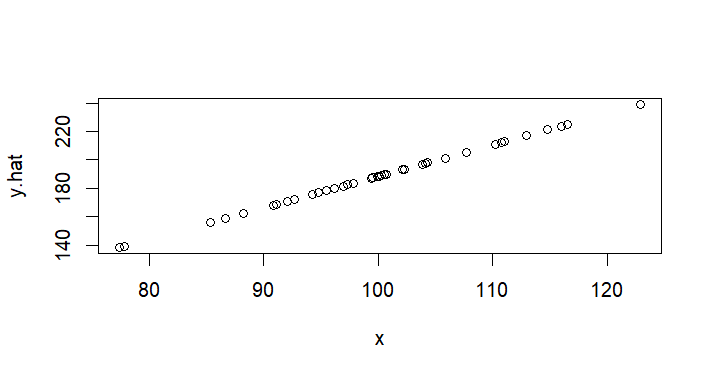
plot(x,y.hat) # 리그레션라인 예측선선
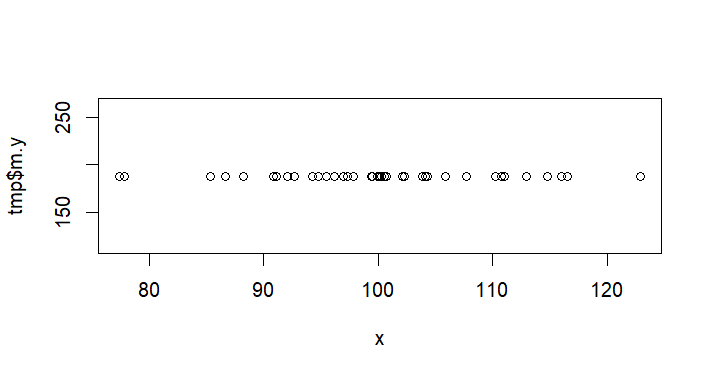
plot(x,tmp$m.y) # 평균 예측선

error <- y-y.hat
explained <- y.hat-m.y
error
# note the below
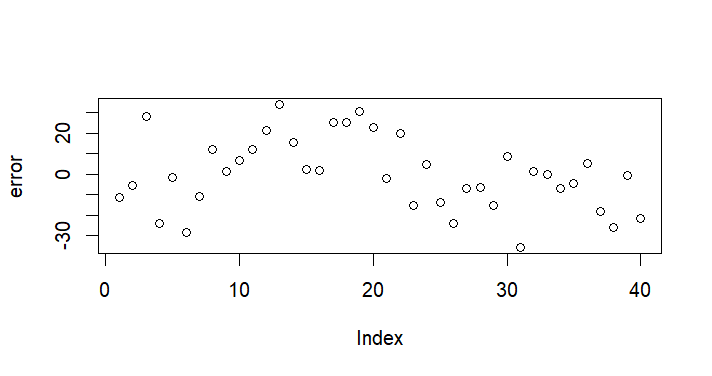
plot(error)
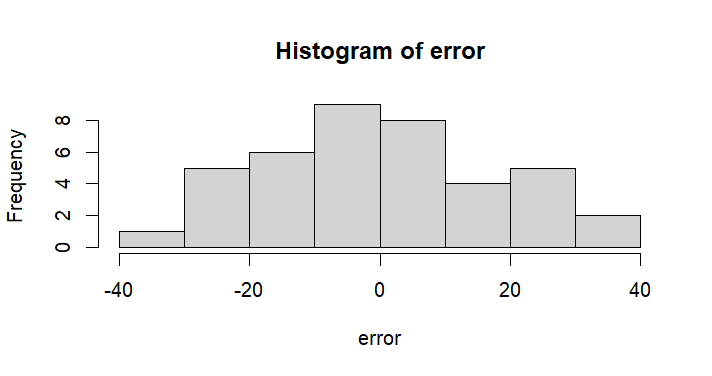
hist(error)
cor(x,error)
################
explained
cor(x,explained)

# see this also
tmp2 <- data.frame(x, explained, error, y)
round(cor(tmp2),3)
###############

ss.res <- sum(error^2)
ss.reg <- sum(explained^2)
ss.y
ss.res
ss.reg
ss.res + ss.reg

k <- 1 # number of IV
df.res <- n - k - 1
df.reg <- 2 - 1 # number of parameter estimation a and b (slope)
ms.res <- ss.res/df.res
ms.reg <- ss.reg/df.reg

ss.reg
df.reg
ms.reg

ss.res
df.res
ms.res

f.cal <- ms.reg/ms.res
f.cal
pf(f.cal, 1, 38, lower.tail = F)
anova(lm.df)
summary(lm.df)
# r square
ss.y
ss.reg
r.sq <- ss.reg/ss.y
r.sq

# standard error for b coefficient
res <- resid(lm.df)
se.b <- sqrt(ms.res/ss.x)
se.b
b + c(-2*se.b, 2*se.b) # as x increased by 1 unit, y would increase b +- 2se.b
# to be exact, we use t.critical value instead of 2
t.crit <- qt(.025, df.res, lower.tail = F)
b + c(-t.crit*se.b, t.crit*se.b)


t.cal <- lm.df$coefficients[2]/se.b
t.cal


pt(t.cal, df.res, lower.tail = F)*2
pf(f.cal, 1, 38, lower.tail = F)

# see also
t.cal^2
f.cal
code output
> rnorm2 <- function(n,mean,sd){ mean+sd*scale(rnorm(n)) }
> set.seed(191)
> n.x <- 40
> m.x <- 100
> s.x <- 10
> x <- rnorm2(n.x, m.x, s.x)
> x
           [,1]
 [1,]  99.35817
 [2,] 107.72169
 [3,] 111.04574
 [4,] 100.65968
 [5,] 103.85350
 [6,] 122.91296
 [7,] 102.07927
 [8,]  96.92756
 [9,] 115.96195
[10,]  94.24901
[11,]  97.30033
[12,] 110.23739
[13,] 114.73077
[14,] 102.28326
[15,] 112.89297
[16,]  96.12475
[17,] 100.23641
[18,]  88.18567
[19,]  94.75283
[20,] 110.71928
[21,] 105.81396
[22,]  99.89274
[23,] 104.14215
[24,] 103.82149
[25,]  97.85588
[26,] 104.26732
[27,]  90.79210
[28,]  86.64193
[29,]  91.08626
[30,]  77.77150
[31,] 116.52461
[32,]  99.52034
[33,]  85.34661
[34,]  96.14854
[35,] 100.53925
[36,]  95.45190
[37,]  77.35589
[38,] 100.05830
[39,]  92.06457
[40,]  92.67148
attr(,"scaled:center")
[1] -0.08680858
attr(,"scaled:scale")
[1] 1.039345
> ss.x <- sum((m.x - x)^2)
> df.x <- n.x - 1
> ss.x/df.x
[1] 100
> var(x)
     [,1]
[1,]  100
>
> # linear relationship
> a <- 2
> b <- -10
> n.y <- n.x
> re <- rnorm(n.y, 0, 20)
> y <- (a*x) + b + re
> y
          [,1]
 [1,] 175.7367
 [2,] 200.0202
 [3,] 241.0439
 [4,] 166.0401
 [5,] 195.5682
 [6,] 210.8411
 [7,] 181.9459
 [8,] 193.8544
 [9,] 225.4417
[10,] 182.5276
[11,] 194.5656
[12,] 232.4421
[13,] 255.3070
[14,] 209.0313
[15,] 219.1602
[16,] 181.7819
[17,] 214.3124
[18,] 187.2961
[19,] 207.3581
[20,] 235.0318
[21,] 199.2244
[22,] 208.1031
[23,] 182.2575
[24,] 201.4683
[25,] 169.6124
[26,] 173.7941
[27,] 161.0332
[28,] 152.1292
[29,] 153.4874
[30,] 147.7652
[31,] 189.2685
[32,] 188.5691
[33,] 155.5620
[34,] 172.8731
[35,] 184.9119
[36,] 183.3182
[37,] 119.8266
[38,] 162.6349
[39,] 170.0872
[40,] 150.7684
attr(,"scaled:center")
[1] -0.08680858
attr(,"scaled:scale")
[1] 1.039345
> m.y <- mean(y)
> df.y <- n.y - 1
> ss.y <- sum((y-m.y)^2)
> ss.y/df.y
[1] 804.2779
> var(y)
         [,1]
[1,] 804.2779
>
> prod <- (x-m.x)*(y-m.y)
> sp <- sum(prod)
> sp/df.y
[1] 222.3867
> cov(x,y)
         [,1]
[1,] 222.3867
>
> s.x <- sd(x)
> s.y <- sd(y)
> (sp/df.y)/(s.x*s.y)
[1] 0.7841619
> cor(x,y)
          [,1]
[1,] 0.7841619
>
> df.y
[1] 39
> df.x
[1] 39
>
> sqrt(ss.x/df.x) # s.x 값이 이것
[1] 10
> sd(x)
[1] 10
> sqrt(ss.y/df.y) # s.y 값이 이것
[1] 28.35979
> sd(y)
[1] 28.35979
>
> cov(x,y)/(s.x*s.y)
          [,1]
[1,] 0.7841619
> (sp/df.y)/sqrt((ss.x/df.x)*(ss.y/df.y))
[1] 0.7841619
> sp/sqrt(ss.x*ss.y) # 분모 분자에서 n-1을 제거하고 보면
[1] 0.7841619
> cor(x,y)
          [,1]
[1,] 0.7841619
>
> # graph with ggplot2
> df <- data.frame(x,y)
> library(ggplot2)
> ggplot(data=df, aes(x,y)) +
+   geom_point(color="blue", size=1.5, pch=1.5) +
+   geom_hline(aes(yintercept=mean(y)), size=1, color="darkgreen") +
+   stat_smooth(method = "lm",
+               formula = y ~ x,
+               geom = "smooth", color="red", size=1)
>
> # note that the red line is y.hat = a + bx,
> # where error value y.hat - y is minimized
> # how to derive a and b
> # how to derive coefficient values
> # see wiki doc at
> # http://commres.net/wiki/deriviation_of_a_and_b_in_a_simple_regression
> lm.df <- lm(y~x, data = df)
> summary(lm.df)

Call:
lm(formula = y ~ x, data = df)

Residuals:
    Min      1Q  Median      3Q     Max
-35.880 -11.932  -0.458  12.199  34.148

Coefficients:
            Estimate Std. Error t value Pr(>|t|)
(Intercept) -33.9867    28.6879  -1.185    0.243
x             2.2239     0.2855   7.790 2.16e-09 ***
---
Signif. codes:
0 ‘***’ 0.001 ‘**’ 0.01 ‘*’ 0.05 ‘.’ 0.1 ‘ ’ 1

Residual standard error: 17.83 on 38 degrees of freedom
Multiple R-squared:  0.6149,	Adjusted R-squared:  0.6048
F-statistic: 60.68 on 1 and 38 DF,  p-value: 2.157e-09

> a <- summary(lm.df)$coefficients[1]
> b <- summary(lm.df)$coefficients[2]
> a
[1] -33.98667
> b
[1] 2.223867
> # y = a + b*x 에서
> b2 <- sp/ss.x
> b3 <- cov(x,y)/var(x,x)
> # m.y = a + (b*m.x) 이므로
> a2 <- m.y - (b2*m.x)
>
> b3
         [,1]
[1,] 2.223867
> b2
[1] 2.223867
> b
[1] 2.223867
>
> a2
[1] -33.98667
> a
[1] -33.98667
>
> #
> # reg, res, total error
> #
> y.hat <- (a+(b*x))
> y.hat2 <- predict(lm.df)
> y.hat == y.hat2
      [,1]
 [1,] TRUE
 [2,] TRUE
 [3,] TRUE
 [4,] TRUE
 [5,] TRUE
 [6,] TRUE
 [7,] TRUE
 [8,] TRUE
 [9,] TRUE
[10,] TRUE
[11,] TRUE
[12,] TRUE
[13,] TRUE
[14,] TRUE
[15,] TRUE
[16,] TRUE
[17,] TRUE
[18,] TRUE
[19,] TRUE
[20,] TRUE
[21,] TRUE
[22,] TRUE
[23,] TRUE
[24,] TRUE
[25,] TRUE
[26,] TRUE
[27,] TRUE
[28,] TRUE
[29,] TRUE
[30,] TRUE
[31,] TRUE
[32,] TRUE
[33,] TRUE
[34,] TRUE
[35,] TRUE
[36,] TRUE
[37,] TRUE
[38,] TRUE
[39,] TRUE
[40,] TRUE
> y
          [,1]
 [1,] 175.7367
 [2,] 200.0202
 [3,] 241.0439
 [4,] 166.0401
 [5,] 195.5682
 [6,] 210.8411
 [7,] 181.9459
 [8,] 193.8544
 [9,] 225.4417
[10,] 182.5276
[11,] 194.5656
[12,] 232.4421
[13,] 255.3070
[14,] 209.0313
[15,] 219.1602
[16,] 181.7819
[17,] 214.3124
[18,] 187.2961
[19,] 207.3581
[20,] 235.0318
[21,] 199.2244
[22,] 208.1031
[23,] 182.2575
[24,] 201.4683
[25,] 169.6124
[26,] 173.7941
[27,] 161.0332
[28,] 152.1292
[29,] 153.4874
[30,] 147.7652
[31,] 189.2685
[32,] 188.5691
[33,] 155.5620
[34,] 172.8731
[35,] 184.9119
[36,] 183.3182
[37,] 119.8266
[38,] 162.6349
[39,] 170.0872
[40,] 150.7684
attr(,"scaled:center")
[1] -0.08680858
attr(,"scaled:scale")
[1] 1.039345
> y.hat
          [,1]
 [1,] 186.9727
 [2,] 205.5720
 [3,] 212.9643
 [4,] 189.8671
 [5,] 196.9697
 [6,] 239.3554
 [7,] 193.0240
 [8,] 181.5673
 [9,] 223.8973
[10,] 175.6106
[11,] 182.3963
[12,] 211.1666
[13,] 221.1593
[14,] 193.4777
[15,] 217.0723
[16,] 179.7820
[17,] 188.9258
[18,] 162.1265
[19,] 176.7310
[20,] 212.2383
[21,] 201.3295
[22,] 188.1615
[23,] 197.6116
[24,] 196.8985
[25,] 183.6318
[26,] 197.8900
[27,] 167.9229
[28,] 158.6935
[29,] 168.5770
[30,] 138.9668
[31,] 225.1485
[32,] 187.3333
[33,] 155.8128
[34,] 179.8349
[35,] 189.5992
[36,] 178.2857
[37,] 138.0425
[38,] 188.5297
[39,] 170.7527
[40,] 172.1024
attr(,"scaled:center")
[1] -0.08680858
attr(,"scaled:scale")
[1] 1.039345
> m.y
[1] 188.4
>
> tmp <- data.frame(y, y.hat, m.y)
> tmp
          y    y.hat   m.y
1  175.7367 186.9727 188.4
2  200.0202 205.5720 188.4
3  241.0439 212.9643 188.4
4  166.0401 189.8671 188.4
5  195.5682 196.9697 188.4
6  210.8411 239.3554 188.4
7  181.9459 193.0240 188.4
8  193.8544 181.5673 188.4
9  225.4417 223.8973 188.4
10 182.5276 175.6106 188.4
11 194.5656 182.3963 188.4
12 232.4421 211.1666 188.4
13 255.3070 221.1593 188.4
14 209.0313 193.4777 188.4
15 219.1602 217.0723 188.4
16 181.7819 179.7820 188.4
17 214.3124 188.9258 188.4
18 187.2961 162.1265 188.4
19 207.3581 176.7310 188.4
20 235.0318 212.2383 188.4
21 199.2244 201.3295 188.4
22 208.1031 188.1615 188.4
23 182.2575 197.6116 188.4
24 201.4683 196.8985 188.4
25 169.6124 183.6318 188.4
26 173.7941 197.8900 188.4
27 161.0332 167.9229 188.4
28 152.1292 158.6935 188.4
29 153.4874 168.5770 188.4
30 147.7652 138.9668 188.4
31 189.2685 225.1485 188.4
32 188.5691 187.3333 188.4
33 155.5620 155.8128 188.4
34 172.8731 179.8349 188.4
35 184.9119 189.5992 188.4
36 183.3182 178.2857 188.4
37 119.8266 138.0425 188.4
38 162.6349 188.5297 188.4
39 170.0872 170.7527 188.4
40 150.7684 172.1024 188.4
> plot(x,y) # 원래 데이터터
> plot(x,y.hat) # 리그레션라인 예측선선
> plot(x,tmp$m.y) # 평균 예측선
>
> error <- y-y.hat
> explained <- y.hat-m.y
> error
             [,1]
 [1,] -11.2359564
 [2,]  -5.5518187
 [3,]  28.0796455
 [4,] -23.8269825
 [5,]  -1.4014742
 [6,] -28.5142499
 [7,] -11.0781515
 [8,]  12.2870686
 [9,]   1.5443968
[10,]   6.9169740
[11,]  12.1692981
[12,]  21.2754922
[13,]  34.1477152
[14,]  15.5535765
[15,]   2.0879605
[16,]   1.9999551
[17,]  25.3866091
[18,]  25.1695629
[19,]  30.6270426
[20,]  22.7934996
[21,]  -2.1051048
[22,]  19.9415577
[23,] -15.3540820
[24,]   4.5697607
[25,] -14.0193869
[26,] -24.0959095
[27,]  -6.8896271
[28,]  -6.5642357
[29,] -15.0896661
[30,]   8.7983528
[31,] -35.8800136
[32,]   1.2357770
[33,]  -0.2508120
[34,]  -6.9618190
[35,]  -4.6873617
[36,]   5.0325839
[37,] -18.2159090
[38,] -25.8947992
[39,]  -0.6654576
[40,] -21.3340113
attr(,"scaled:center")
[1] -0.08680858
attr(,"scaled:scale")
[1] 1.039345
> # note the below
> plot(error)
> hist(error)
> cor(x,error)
             [,1]
[1,] 7.981058e-17
> ################
> explained
             [,1]
 [1,]  -1.4273520
 [2,]  17.1720033
 [3,]  24.5642656
 [4,]   1.4670349
 [5,]   8.5696709
 [6,]  50.9553654
 [7,]   4.6240241
 [8,]  -6.8327027
 [9,]  35.4972458
[10,] -12.7894406
[11,]  -6.0037071
[12,]  22.7665939
[13,]  32.7592720
[14,]   5.0776653
[15,]  28.6722546
[16,]  -8.6180356
[17,]   0.5257494
[18,] -26.2734989
[19,] -11.6690128
[20,]  23.8382597
[21,]  12.9294844
[22,]  -0.2385288
[23,]   9.2115978
[24,]   8.4984744
[25,]  -4.7682316
[26,]   9.4899547
[27,] -20.4771504
[28,] -29.7065732
[29,] -19.8229799
[30,] -49.4332197
[31,]  36.7485236
[32,]  -1.0667066
[33,] -32.5871819
[34,]  -8.5651393
[35,]   1.1992231
[36,] -10.1143632
[37,] -50.3574953
[38,]   0.1296534
[39,] -17.6473510
[40,] -16.2976456
attr(,"scaled:center")
[1] -0.08680858
attr(,"scaled:scale")
[1] 1.039345
> cor(x,explained)
     [,1]
[1,]    1
>
> # see this also
> tmp2 <- data.frame(x, explained, error, y)
> round(cor(tmp2),3)
              x explained error     y
x         1.000     1.000 0.000 0.784
explained 1.000     1.000 0.000 0.784
error     0.000     0.000 1.000 0.621
y         0.784     0.784 0.621 1.000
> ###############
>
> ss.res <- sum(error^2)
> ss.reg <- sum(explained^2)
> ss.y
[1] 31366.84
> ss.res
[1] 12079.06
> ss.reg
[1] 19287.78
> ss.res + ss.reg
[1] 31366.84
>
> k <- 1 # number of IV
> df.res <- n - k - 1
> df.reg <- 2 - 1 # number of parameter estimation a and b (slope)
> ms.res <- ss.res/df.res
> ms.reg <- ss.reg/df.reg
>
> ss.reg
[1] 19287.78
> df.reg
[1] 1
> ms.reg
[1] 19287.78
>
> ss.res
[1] 12079.06
> df.res
[1] 38
> ms.res
[1] 317.87
>
> f.cal <- ms.reg/ms.res
> f.cal
[1] 60.67819
> pf(f.cal, 1, 38, lower.tail = F)
[1] 2.157284e-09
> anova(lm.df)
Analysis of Variance Table

Response: y
          Df Sum Sq Mean Sq F value    Pr(>F)
x          1  19288 19287.8  60.678 2.157e-09 ***
Residuals 38  12079   317.9
---
Signif. codes:
0 ‘***’ 0.001 ‘**’ 0.01 ‘*’ 0.05 ‘.’ 0.1 ‘ ’ 1
> summary(lm.df)

Call:
lm(formula = y ~ x, data = df)

Residuals:
    Min      1Q  Median      3Q     Max
-35.880 -11.932  -0.458  12.199  34.148

Coefficients:
            Estimate Std. Error t value Pr(>|t|)
(Intercept) -33.9867    28.6879  -1.185    0.243
x             2.2239     0.2855   7.790 2.16e-09 ***
---
Signif. codes:
0 ‘***’ 0.001 ‘**’ 0.01 ‘*’ 0.05 ‘.’ 0.1 ‘ ’ 1

Residual standard error: 17.83 on 38 degrees of freedom
Multiple R-squared:  0.6149,	Adjusted R-squared:  0.6048
F-statistic: 60.68 on 1 and 38 DF,  p-value: 2.157e-09

> # r square
> ss.y
[1] 31366.84
> ss.reg
[1] 19287.78
> r.sq <- ss.reg/ss.y
> r.sq
[1] 0.6149098
>
> # standard error for b coefficient
> res <- resid(lm.df)
> se.b <- sqrt(ms.res/ss.x)
> se.b
[1] 0.285491
> b + c(-2*se.b, 2*se.b) # as x increased by 1 unit, y would increase b +- 2se.b
[1] 1.652885 2.794849
> # to be exact
> t.crit <- qt(.025, df.res, lower.tail = F)
> # note that t.crit is equivalent to 2 in z-test
> b + c(-t.crit*se.b, t.crit*se.b)
[1] 1.645921 2.801813
> # see http://commres.net/wiki/c/ms/2023/schedule/w11.lecture.note#%EA%B8%B0%EC%9A%B8%EA%B8%B0_b%EC%97%90_%EB%8C%80%ED%95%9C_%ED%86%B5%EA%B3%84%ED%95%99%EC%A0%81%EC%9D%B8_%ED%85%8C%EC%8A%A4%ED%8A%B8
>
>
> t.cal <- lm.df$coefficients[2]/se.b
> t.cal
       x
7.789621
>
>
> pt(t.cal, df.res, lower.tail = F)*2
           x
2.157284e-09
> pf(f.cal, 1, 38, lower.tail = F)
[1] 2.157284e-09
>
> # see also
> t.cal^2
       x
60.67819
> f.cal
[1] 60.67819
>
>
>

