interaction_effects_in_regression_analysis:answer_ex2
> summary(m1)

Call:
lm(formula = read ~ math)

Residuals:
     Min       1Q   Median       3Q      Max
-17.2392  -4.8701  -0.3633   4.6803  23.5592

Coefficients:
            Estimate Std. Error t value Pr(>|t|)
(Intercept) 14.07254    3.11582   4.516 1.08e-05 ***
math         0.72481    0.05827  12.438  < 2e-16 ***
---
Signif. codes:  0 ‘***’ 0.001 ‘**’ 0.01 ‘*’ 0.05 ‘.’ 0.1 ‘ ’ 1

Residual standard error: 7.701 on 198 degrees of freedom
Multiple R-squared:  0.4386,	Adjusted R-squared:  0.4358
F-statistic: 154.7 on 1 and 198 DF,  p-value: < 2.2e-16
math의 read 분산에 대한 설명력: 43.9%
> summary(m2)

Call:
lm(formula = read ~ socst)

Residuals:
     Min       1Q   Median       3Q      Max
-23.3961  -6.4365  -0.3152   5.6686  18.6686

Coefficients:
            Estimate Std. Error t value Pr(>|t|)
(Intercept) 21.12595    2.84404   7.428 3.22e-12 ***
socst        0.59353    0.05317  11.163  < 2e-16 ***
---
Signif. codes:  0 ‘***’ 0.001 ‘**’ 0.01 ‘*’ 0.05 ‘.’ 0.1 ‘ ’ 1

Residual standard error: 8.053 on 198 degrees of freedom
Multiple R-squared:  0.3862,	Adjusted R-squared:  0.3831
F-statistic: 124.6 on 1 and 198 DF,  p-value: < 2.2e-16
socst의 read 분산에 대한 설명력: 38.6%
> summary(m3)

Call:
lm(formula = read ~ math + socst)

Residuals:
     Min       1Q   Median       3Q      Max
-18.8729  -4.8987  -0.6286   5.2380  23.6993

Coefficients:
            Estimate Std. Error t value Pr(>|t|)
(Intercept)  7.14654    3.04066   2.350   0.0197 *
math         0.50384    0.06337   7.951 1.41e-13 ***
socst        0.35414    0.05530   6.404 1.08e-09 ***
---
Signif. codes:  0 ‘***’ 0.001 ‘**’ 0.01 ‘*’ 0.05 ‘.’ 0.1 ‘ ’ 1

Residual standard error: 7.024 on 197 degrees of freedom
Multiple R-squared:  0.5354,	Adjusted R-squared:  0.5306
F-statistic: 113.5 on 2 and 197 DF,  p-value: < 2.2e-16
math와 socst의 설명력 (combined): 53.5%
math + socst = 43.9 + 38.6 = 82.5%
겹친부분 의 설명력: 82.5 - 53.5 = 29%
따라서 math 고유의 영향력: 43.9 - 29 = 14.9
socst 고유의 영향력: 38.6 - 29 = 9.6
위의 두 변인을 동시에 투입(enter)한 경우,
math 는 14.9 로 설명력을 평가받고 (t-test),
socst는 9.6 로 설명력을 평가받는다 (t-test, too).
> library(ppcor)
> spcor.test(read, math, socst)
   estimate      p.value statistic   n gp  Method
1 0.3861521 1.770448e-08  5.875646 200  1 pearson
> spcor.test(read, math, socst)$estimate^2
[1] 0.1491134
> spcor.test(read, socst, math)$estimate^2
[1] 0.09674116
>
즉, 두 변인 고유 영향력이 통계적으로 유의미하다.
그런데 . . . .
아래를 보면
> summary(m4)

Call:
lm(formula = read ~ math * socst)

Residuals:
     Min       1Q   Median       3Q      Max
-18.6071  -4.9228  -0.7195   4.5912  21.8592

Coefficients:
             Estimate Std. Error t value Pr(>|t|)
(Intercept) 37.842715  14.545210   2.602  0.00998 **
math        -0.110512   0.291634  -0.379  0.70514
socst       -0.220044   0.271754  -0.810  0.41908
math:socst   0.011281   0.005229   2.157  0.03221 *
---
Signif. codes:  0 ‘***’ 0.001 ‘**’ 0.01 ‘*’ 0.05 ‘.’ 0.1 ‘ ’ 1

Residual standard error: 6.96 on 196 degrees of freedom
Multiple R-squared:  0.5461,	Adjusted R-squared:  0.5392
F-statistic: 78.61 on 3 and 196 DF,  p-value: < 2.2e-16
y hat ~ 37.842715 + -0.110512 x1 + -0.220044 x2 + 0.011281 x1x2
y hat ~ 37.842715 + -0.220044 x2 + (-0.110512 + 0.011281 x2) x1  # x1으로 regression한 결과
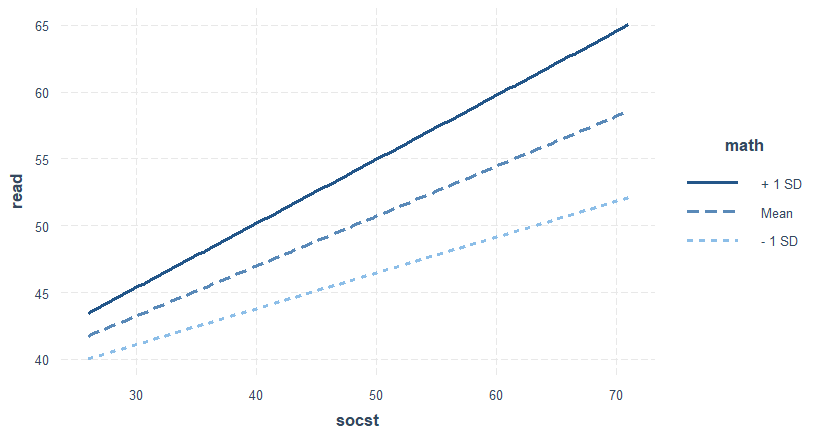
y hat ~ 37.842715 + -0.110512 x1 + (-0.220044 + 0.011281 x1) x2  # x2
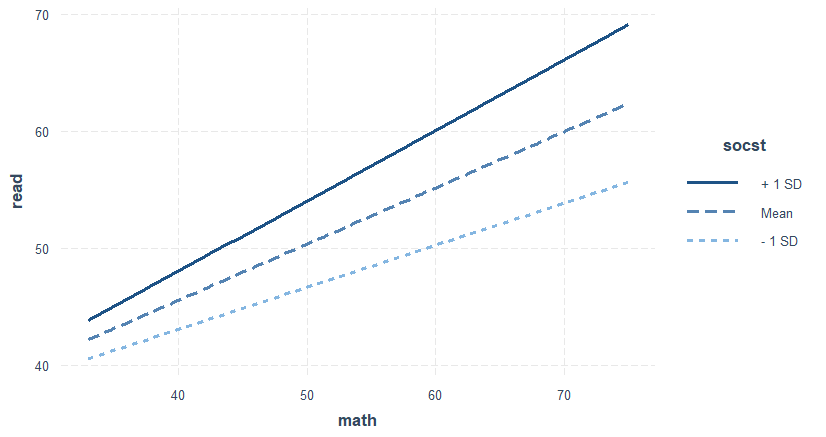
Main effects 의 significance level이 (p-value < .05) 사라지고 interaction effect가 significant하게 되었다는 것은 math의 read에 대한 설명력이 socst의 양에 따라서 달라지게 된다는 것을, 그리고 동시에 socst의 설명력이 math의 변화에 따라서 달라지게 된다는 것을 말하는 것으로 이를 종합적으로 고려하면 두 메인 독립변인의 효과는 존재한다고 설명하는 것이 (m3에 따라서) 합리적이다. 아래는 이를 도식화한 그래프이다. 첫 번째 그래프를 보면
- math 단위가 증가하면 read 점수가 증가하게 되는 것을 의미한다
- 그런데 socst 점수가 높은 경우에는 그 증가분이 증폭되고 (기울기가 커지고)
- socst점수가 낮은 경우에는 그 증가분이 둔화되는 경향을 보인다.
interaction_effects_in_regression_analysis/answer_ex2.txt · Last modified: by hkimscil


