adjusted_r_squared
Adjusted R Squared
Adjusted R2 vs. R2
아래는 Regression의 E.g. 3 Simple Regression 예이다.
| DATA | |
| x | y |
| 1 | 1 |
| 2 | 1 |
| 3 | 2 |
| 4 | 2 |
| 5 | 4 |
| Model Summary(b) | ||||
| Model | R | R Square | Adjusted R Square | Std. Error of the Estimate |
| 1 | 0.903696114 | 0.816666667 | 0.755555556 | 0.605530071 |
r-square:
- $\displaystyle r^2=\frac{SS_{total}-SS_{res}}{SS_{total}} = \frac{\text{Explained sample variability}}{\text{Total sample variability}}$
- $\displaystyle r^2=\frac{SS_{total}-SS_{res}}{SS_{total}} = 1-\frac{SS_{res}}{SS_{total}} = 0.816666667 = R^2 $
- Usually interpret with % ( by multiplying 100 to $r^2$ )
Adjusted r-square:
- $\displaystyle r^2=\frac{SS_{total}-SS_{res}}{SS_{total}} = 1 - \frac{SS_{res}}{SS_{total}} $ ,
- This is equivalent to: $ \displaystyle 1 - \frac {Var_{rei}}{Var_{total}} $
- $\text{Var} = \text{MS} = s^{2} = \displaystyle \frac {SS}{n} $
- 여기서 n 대신에 각각 아래의 값을 사용한다면 (n = 샘플 숫자, p = 변인 숫자),
- $\displaystyle Var_{res} = \frac {SS_{res}}{n-p-1}$
- $\displaystyle Var_{total} = \frac {SS_{total}}{n-1}$
- 따라서,
- $\displaystyle \text{Adjusted } R^{2} = 1 - \displaystyle \frac {\displaystyle \frac {SS_{res}}{n-p-1}}{\displaystyle \frac {SS_{total}}{n-1}} $
- This is the same logic as we used n-1 instead of n in order to get estimation of population standard deviation with a sample statistics.
- Therefore, the Adjusted r2 = 0.755555556
왜 Adjusted R squared 값을 사용하는가?
- p가 커지면, 즉 . . . .
- Adjusted R squared 값이 작아지는 경향이 생긴다.
- 그런데, p가 커진다는 것은 독립변인을 자꾸 추가한다는 것인데, 독립변인 모든 X들이 사실은 Y를 설명하는 것이 아니라고 해도, (즉, X와 Y가 이론적인 원인과 결과의 관계를 갖지 않더라도) 자연적으로 R2값은 커지게 된다. 이런 경우를 over-fit 되었다고 한다 (R square 값에 대한 통계적인 테스트(F-test)를 goodness of fit test라고 부르는 것에 상응하여). 그러나, Adjusted R squared 값은 p값이 계산에 작용되기에 (X변인이 추가되고 있는) 어느시점에서 작아지게 된다. 이 작아지는 시점이 over-fit을 피하는 순간이라고 판단하게 된다.
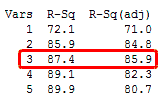
- 가령 위의 경우, 연구자는 독립변인으로 처음 세가지만 사용할 것을 결정할 수 있는데 이는 Adjusted R 제곱값이 4번째 변인 투입부터 줄기때문이다. 반면에 R 제곱값은 계속 커진다.
adjusted_r_squared.txt · Last modified: by hkimscil

