b:head_first_statistics:variability_and_spread
This is an old revision of the document!
Variability and Spread
Who are you going to use for the upcoming game (basketball)?
| A | ||||||
|---|---|---|---|---|---|---|
| 7 | 8 | 9 | 10 | 11 | 12 | 13 |
| 1 | 1 | 2 | 2 | 2 | 1 | 1 |
| B | ||||
|---|---|---|---|---|
| 7 | 9 | 10 | 11 | 13 |
| 1 | 2 | 4 | 2 | 1 |
| C | ||||||
|---|---|---|---|---|---|---|
| 3 | 6 | 7 | 10 | 11 | 13 | 30 |
| 2 | 1 | 2 | 3 | 1 | 1 | 1 |
a <- c(7,8,9,9,10,10,11,11,12,13)
b <- c(7,9,9,10,10,10,10,11,11,13)
c <- c(3,3,6,7,7,10,10,10,11,13,30)
## c <- c(3,3,6,7,7,10,11,13,15,20,30)

data <- list(a,b,c)
data
sapply(data,mean)
sapply(data,median)
sapply(data,range)

sapply(data,sd)
sapply(data,var)
> a <- c(7,8,9,9,10,10,11,11,12,13)
> b <- c(7,9,9,10,10,10,10,11,11,13)
> c <- c(3,3,6,7,7,10,10,10,11,13,30)
>
> data <- list(a,b,c)
> data
[[1]]
 [1]  7  8  9  9 10 10 11 11 12 13

[[2]]
 [1]  7  9  9 10 10 10 10 11 11 13

[[3]]
 [1]  3  3  6  7  7 10 10 10 11 13 30

> sapply(data,mean)
[1] 10 10 10
> sapply(data,median)
[1] 10 10 10
> sapply(data,range)
     [,1] [,2] [,3]
[1,]    7    7    3
[2,]   13   13   30
>
>
> sapply(data,sd)
[1] 1.825742 1.563472 7.362065
> sapply(data,var)
[1]  3.333333  2.444444 54.200000
>
range
교재에서는 upper bound와 lower bound의 차이값을 range라고 설명하지만, R에서는 lower와 upper bound값을 제시한 것이 range값이 된다. 즉,
> sapply(data,range)
     [,1] [,2] [,3]
[1,]    7    7    3
[2,]   13   13   30
13 - 7 = 6
13 - 7 = 6
30 - 3 = 27
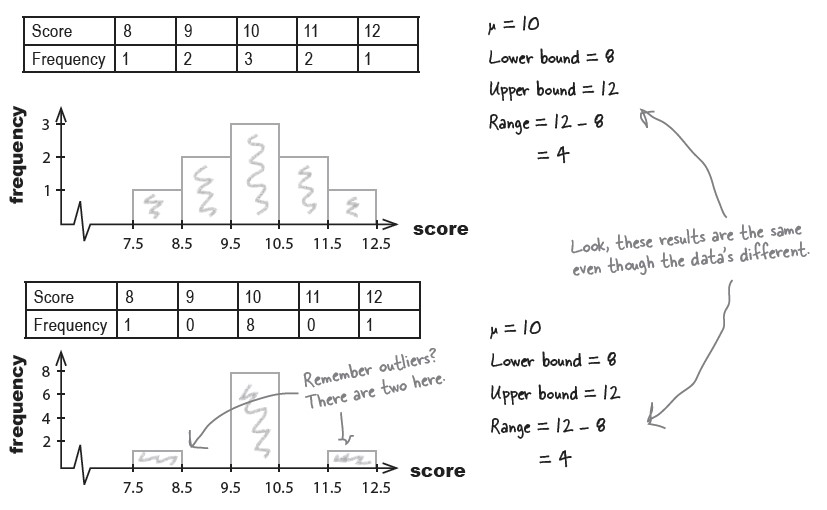
그러나 range도 데이터의 분포를 정확하게 그려주지는 않는다. 아래의 첫번째, 두번째 데이터의 range는 모두 4 (8-12). 그러나, 개인 점수들의 분포는 다른 양상을 보인다.
즉,
아웃라이어의 (극단치의) 문제
a ← c(1,1,1,2,2,2,2,3,3,3,3,3,4,4,4,4,5,5,5}

b ← c(1,1,1,2,2,2,2,3,3,3,3,3,4,4,4,4,5,5,5, 10}
range(a) vs. range(b)
이런 두 그룹간의 range 차이는 outlier에 기인한다.
- $ \sum \text{deviation score}^2 = \sum \text{ds}^2 $
- $ \sum \text{error}^2 $
- error = 평균값으로 개인값을 추측했을 때 발생하는 오차
- (평균으로 추측했을 때 생기는) 오차의 제곱의 합
- (오차의) 제곱의 합
- 제곱의 합
- Sum of Square (SS)
- $ \sum \text{ds}^2 = \text{SS} = \text{Sum of Square} $ 1)
- $$ \text{variance} = \frac {SS}{n-1} = \frac {SS}{df}$$
- calculation of variance (an easy way) see variance calculation
- $ \displaystyle \frac{\sum(X_{i})}{N} - \mu^2$
1)
표준오차_잔여변량_standard_error_residual의 Figure 1을 보면 x와 y가 모두 숫자로 측정된 변인일 때, Y의 평균만을 사용해서 Y값을 예측했을 때는 SStotal이라고 설명한다.
b/head_first_statistics/variability_and_spread.1600660120.txt.gz · Last modified: 2020/09/21 12:48 by hkimscil


