This is an old revision of the document!
Table of Contents
Regression
두 변인 간의 상관관계가 완전하다면 (r=1.0 혹은 r=-1.0) 변인 간의 상관관계에 의한 그래프는 아래와 같을 것이다.
$$Y = a + bX $$
여기서, a는 절편이라고 (intercept) 하고, b는 기울기라고 (slope) 한다. 즉, 완벽한 상관관계일 때 나타나는 관계 그래프는 일차 방정식의 형태를 띄게 된다 (따라서 이를 linear한 관계라고 한다).
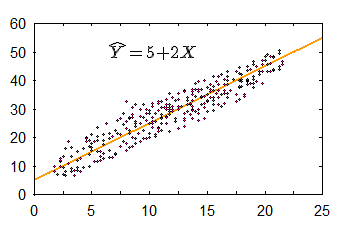
그리고 이렇게 해서 얻는 곡선을 회귀 곡선이라고 (regression line) 하며, 이 곡선을 표현하는 등식을 회귀방정식 (regression equation)이라고 한다. 실제에서는 r 값이 1 혹은 -1인 경우가 드물다. 이것이 의미하는 것은 데이터가 어느 일정한 방향성과 응집성을 가지고는 있으나, 이것이 완변한 선형을 이루지는 않는다는 것을 의미한다 (그림 참조). 이와 같은 데이터에도 회귀곡선을 그릴 수 있는데 (따라서 회귀식을 구할 수 있는데) 이 장에서는 이에 대해서 설명한다.
그림에서 보는 것처럼, 실제 데이터에서 얻게 되는 회귀 방정식은 정확한 데이터의 움직임을 나타내 줄 수는 없으므로 추정치를 표시하는 지표로 사용된다.
$$\hat Y = a + bX $$
위의 경우에는,
$$\hat Y = 5 + 2 X $$
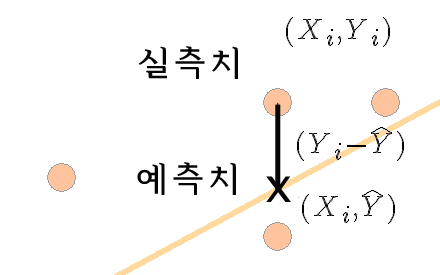
여기서 $\hat Y$ 는 $X_i$ 에서 실제 데이터 값을 ( $Y_i$ ) 추정해주는 값을 말하며 Y hat이라고 읽는다. 완벽한 correlatin이 아닐 경우에 $\hat Y$ 의 값은 실제 $Y_i$ 값과 다를 수 있다. 회귀식을 이용하여 구한 $\hat Y$ 값은 기대치 혹은 예측치라고 할 수 있으며, 데이터를 이용하여 알아낸 $Y_i$ 값은 관측치 혹은 실측치라고 할 수 있는데 이와 같이 실제 데이터의 관측치와 기대치와의 차이는 그림에서 괄호로 묶은 부분을 의미하며 이는 $(Y_i - \hat Y)$ 로 표현한다.
상관관계에서 살펴 본것처럼, 관측된 데이터는 최소자승 (Least Squared) 법을 이용하여 회귀식을 유도할 수 있는데, 이때의 절편과 기울기 값은 각각 다음과 같이 구할 수 있다:
$$b = \displaystyle \frac{SP}{SS_X}$$
$$a = \displaystyle \overline{Y} - b \overline{X} $$
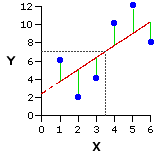
최소자승이 의미하는 것은 옆의 그림과 같다. regression line (회귀선)으로 X 값에 해당하는 Y 값을 예측할 수 있는데, 이때에는 실측값과 차이가 날 수 있다. 이 차이가 위의 그림에서 녹색선인데, 이 녹색선의 합이 최소값을 갖도록하는 것을 최소자승(least squared)법이라고 한다.
간혹, 다른 교재를 보면,
$b = r * \displaystyle \frac{s_{Y}}{s_{X}}$
와 같이 나타나는데 이 둘은 같은 의미를 갖는다.
동일한 공식 설명:
$ r = \displaystyle \frac{SP}{\sqrt{SS_X SS_Y}}\text{, threfore } $
$ SP = r * \displaystyle \sqrt{SS_X SS_Y} $ 그리고
$ b = \displaystyle \frac{SP}{SS_X} $ 따라서
$ = \displaystyle \frac{r * \sqrt{SS_X SS_Y}}{SS_X} = r * \frac{\sqrt{SS_Y}}{\sqrt{SS_X}} $ 따라서
$ = r * \displaystyle \frac{s_Y}{s_X} $
아래 예를 살펴보자.
| 국어와 영어 점수 간의 상관관계 | ||
|---|---|---|
| Korean | English | |
| A | 1 | 1 |
| B | 4 | 2 |
| C | 5 | 4 |
| D | 3 | 3 |
| E | 7 | 5 |
| 국어와 영어 점수 간의 상관관계 | |||||
|---|---|---|---|---|---|
| X | Y | $X^2$ | $Y^2$ | $XY$ | |
| A | 1 | 1 | 1 | 1 | 1 |
| B | 4 | 2 | 16 | 4 | 8 |
| C | 5 | 4 | 25 | 16 | 20 |
| D | 3 | 3 | 9 | 9 | 9 |
| E | 7 | 5 | 49 | 25 | 35 |
| $\sum = 20 $ | $\sum = 15 $ | $\sum = 100 $ | $\sum = 55 $ | $\sum = 73 $ | |
| $\overline{X}=4$ | $\overline{Y}=3$ | ||||
위에서,
\begin{eqnarray}
SS_{X} & = & \sum X_i^2 - \frac{(\sum X)^2}{n} \nonumber \\
& = & 100-\frac{20^2}{5}= 20 \nonumber
\end{eqnarray}
\begin{eqnarray} SS_{Y} & = & \sum Y_i^2 - \frac{(\sum Y)^2}{n} \nonumber \\ & = & 55 -\frac{15^2}{5}= 10 \nonumber \end{eqnarray}
\begin{eqnarray} SP & = & \sum X_i Y_i - \frac{(\sum X)(\sum Y)}{n} \nonumber \\ & = & 73 -\frac{20*15}{5}= 13 \nonumber \end{eqnarray}
따라서
\begin{eqnarray} b & = & \frac{SP}{SS_{X}} \nonumber \\ & = & \frac{13}{20}= 0.65 \nonumber \end{eqnarray}
\begin{eqnarray} a & = & \overline{Y} - b \overline{X} \nonumber \\ & = & 3 - 0.65 (4)= 0.4 \nonumber \end{eqnarray}
따라서 회귀 공식은 다음과 같다.
$$\hat Y = 0.4 + 0.65 X$$
이 회귀공식은 X값의 범위에 속한 데이터들 중 각각의 Xi에서 Yi 값을 대표하는 지점을 의미한다. 가령, Xi가 1일때의 Yi값은 1.05를 기대치로 제시하고 있지만, 실제 관측된 Y값은 1이다. 만약에 X = 1에서의 데이터가 더 있다고 가정하고 (이 예의 경우에는 하나의 케이스 밖에 없지만) 이 때의 Y값은 2라고 한다고 해도, 예측치는 공식에 의해서 도출되는 1일 것이다. 첫 번째 케이스의 경우에는 - 0.05의 오차가 있었으며, 두 번째의 케이스는 0.95의 오차가 있었다고 하겠다 $(Y_i - \hat Y)$ . 그리고, 이는 회귀곡선을 이용한 예측치가 갖는 오차이다. 이를 residual error라고 표기한다. 각각의 Yi 에 대해서 residual error 를 구할 수 있는데, 이 오차의 제곱의 합을 SSres 라고 표현하게 된다. 이에 대한 자세한 설명은 아래에서 하도록 한다.
표준오차 잔여변량 (standard error residual)
 Fig. ##: 평균값만으로 Y값을 예측하는 경우
figure ##은 변인 X 와 Y 간의 관계를 (association) 나타내주는 그래프이다. 그리고, 이 그래프에서 $\overline{Y} = 30$ 이다. 이 데이터 중에서 X에 대한 정보가 없다고 가정하고, Y 관측치를 예측하려면 어떻게 해야 할까? 당연히 연구자는 자신이 가지고 있는 Y 변인 데이터의 중앙값인 평균 ( $\overline{Y}$ ) 을 사용하려고 할 것이다. 이 평균값으로 각 개인의 값(Y)을 예측한 한 후, 이 오차를 제곱하여 모두 더한 것이 바로 Sum of Square 값인 $SS$ 이다.
연구자가 각 케이스에 해당하는 Y 값에 대응하는 X 값을 알고 있고, 이를 함께 고려하면 (Covariance) Y값 예측에 도움을 줄 수 있다는 것을 알았다. 즉, Y 변인의 평균값을 Y의 대표값이라고 하기에는 개인의 실제값 (혹은 관측치)과 평균값 간의 오차가 너무 큰데, 이 오차를 줄이기 위해서 만들어진 것이 회귀선이다 (regression line, 오렌지 라인). 따라서 회귀선은 평균값만을 사용할 때 나타나는 오차를 줄여주는 역할을 한다.
이렇게 줄어든 오차를 설명된 오차라고 (explained error) 한다. 예를 들면, figure ##에서 $X=15$ 일때의 Y 값의 하나인 $Y_i$ 값(실측치)은 평균값인 $\overline{Y}$ 값에서 녹색선과 검은색 선의 길이만큼의 오차를 갖는다. 이렇게 된 이유는 연구자가 오직 Y 값만을 분석하여 – 즉, Y 평균값만을 가지고 – Y를 예측했기 때문이다 (즉, 일반적으로 분산을 구하는 방식으로 Y값을 예측함).
 Fig. ##: X값을 함께 고려하여 (즉, Regression Line을 그려) Y값을 예측하는 경우
연구자는 데이터를 이용하여 회귀식의 b값과 a값을 구할 수 있다. 그리고 이를 사용하면, 평균값 $\overline{Y}$ 이 주는 오차에 비해서 상대적으로 작은 (녹색선만큼을 뺀 분량의) 오차를 갖도록 할 수 있다. 즉, 회귀식이 보다 정확한 예측을 가능하도록 하여 주는 것이다. 이렇게 회귀식을 사용하여 (즉, b라는 기울기를 사용하여) 관측치를 예측함으로써, 평균값을 사용했을 때보다 줄어드는 오차 부분을 설명된 오차라고 (explained error: 녹색 분의 (제곱의) 합) 한다. 그러나, 회귀선을 사용하더라도 연구자는 검은색 만큼의 오차는 피할 수 없다. 이를 설명되지 않은 오차라고 (unexplained error: 검은색 분의 (제곱의) 합) 한다. 그리고 이 각각을 regression error 와 residual error라고 부른다.
위 그림의 예를 보면, Xi의 값이 15일때,
- 실제 데이터인 Y값은, Yi로 표현 할 수 있고 (푸른색 + 녹색 + 검정색),
- 추정치인 Y 값은, $\hat{Y}$ (Y hat 이라고 읽는다) 으로 표현 할 수 있으며 (푸른색+ 녹색),
- 전체 Y값의 평균은 $\overline{Y}$ 로 표현할 수 있다 (푸른색).
Y의 데이터 전체가 Y의 평균값에서 ( $\overline{Y}$ ) 얼마나 떨어져 있을까라는 질문에는 각각의 Yi값이 Y 평균값에서 얼마나 떨어져 있는가 (deviation score)를 계산하여 제곱한 후, 이를 모두 더하면 Y값에 대한 SS 값을 구할 수 있을 것이다. 이를 df로 나누어 주면 전체 Y값에 대한 분산값을 구할 수 있겠다. 이것을 전체에러자승 (SStotal ) 이라고 한다.
특정 케이스를 (즉, (Xi, Yi)의 값) 살펴보면, 이 때의 Yi값이 Y의 평균값에서 떨어져 있는 거리를 편차점수라고 한다면, 이 점수는 아래와 같이 구할 수 있다. 즉, $Y_i = \overline{Y} + (\hat Y - \overline{Y}) + (Y_i - \hat Y)$ 이며, 따라서, $Y_i - \overline{Y} = (\hat Y - \overline{Y}) + (Y_i - \hat Y)$ 라고 할 수 있다. 혹은 우리가 이전에 다루었던 것을 생각해 보면, 이 점수는 바로 Sum of Square (SS) 점수이다.
그런데, 이 그림에서 녹색 부분을 보면, 이를 설명된 편차라고 (explained deviation) 할 수 있다. 왜냐하면, Yi값이 평균에서 떨어져 있는 편차점수 중 이 거리에 해당하는 것은 회귀곡선에 의해서 설명되기 때문이다. 반면에 그림에서 흑색 부분에 해당하는 거리는 설명되지 않은 편차라고 (unexplained deviation) 할 수 있다. 평균에서 떨어진 총 편차 중 이 거리는 회귀곡선이 설명하지 못하기 때문이다. 이와 같이 설명된 편차와 설명되지 않은 편차의 합을 (정확히는 각각의 값을 제곱해서 모두 더한 값) 총 편차라고 ( SStotal ) 한다.
따라서 Y 평균 값에 대한 Yi값의 총 편차 값은 설명된 편차와 설명되지 않은 편차로 이루어져 있다.
모든 케이스에 대한 총편차와 설명된 편차, 설명되지 않은 편차 값을 구해서 각각 더해 보면 그 합은 모두 0이 된다. 따라서, 각각의 총편차 값와 설명편차값, 설명되지 않은 편차 값을 제곱한 후 모두 더해 주면 위에서 소개한 것처럼 전체 Y 분산값을 구하기 위한 SS값이 된다. 이를 Sum of Square of Total deviations 혹은 Total variation이라고 하며, 아래와 같이 나타낼 수 있다.
$$SS_{total} = \sum (Y_i-\overline{Y})^2$$
그리고 총편차는 설명된 편차와 설명되지 않은 편차의 합이므로:
$$SS_{explained} = \sum (\hat Y-\overline{Y})^2 = SS_{reg} $$
$$SS_{unexplained} = \sum (Y_i-\hat {Y})^2 = SS_{res} $$
을 합한 점수와 같다.
따라서 $\text{Total variablity of Y = Explained variablility + Unexplained variability} $ 라고 표현할 수 있다.
$SS_{unexplained} = \sum (Y_i-\hat {Y})^2$ 의 값에 df 값인 (N-2) 을 나누어 준 후 루트를 씌워 준 값을 추정치에 대한 표준 오차라고 부르며
이 값을 제곱한 값을 잔여 변량 (residual variance) 혹은 오차 변량(error variance)이라고 부른다
이에 대한 부연설명은 아래에서 다시 하도록 하겠다.
E.g., 1. Simple regression & F-test for goodness of fit
Data file: regression01-bankaccount.sav
아래는 어느 책에서 쓰인 가상 데이터이다. 통장수와 수입, 그리고 가족 구성원의 숫자가 변인이며 총 10 가구에 대한 정보가 수집된 것이다. 여기서는 이 데이터를 이용하여 위에서 언급된 SStotal , SSreg , SSres 에 대한 예를 살펴보도록 한다.
SStotal, 전체에러
| DATA for regression analysis | ||
|---|---|---|
| bankaccount | income | famnum |
| 6 | 220 | 5 |
| 5 | 190 | 6 |
| 7 | 260 | 3 |
| 7 | 200 | 4 |
| 8 | 330 | 2 |
| 10 | 490 | 4 |
| 8 | 210 | 3 |
| 11 | 380 | 2 |
| 9 | 320 | 1 |
| 9 | 270 | 3 |
| m = 8 | 287 | 3.3 |
연구자가 이 데이터를 구한 이유는 통장의 숫자에 (account) 영향을 주는 것으로 가구의 수입(income) (과 가족숫자) 이 있을 것이라고 예상했기 때문이다 1). 연구자는 이 데이터의 기술적인 통계를 살펴보고, account변인의 평균이 8임을 알게 되었다.
    account       income        fammember
 Min.   : 5   Min.   :190.0   Min.   :1.00
 1st Qu.: 7   1st Qu.:212.5   1st Qu.:2.25
 Median : 8   Median :265.0   Median :3.00
 Mean   : 8   Mean   :287.0   Mean   :3.30
 3rd Qu.: 9   3rd Qu.:327.5   3rd Qu.:4.00
 Max.   :11   Max.   :490.0   Max.   :6.00
아래는 평균값인 8만을 이용해서 Y값을 예측해 본 후에 이 예측값과 측정값 (원래데이터)의 차이를 구한후 (error column) 이를 다시 제곱한 것을 (error2 ) 정리한 표이다. 연구자는 현재 Y에 대한 정보만을 가지고 Y값을 예측하는 상황이다. 따라서, 평균값인 $\overline{Y}$ 를 사용한 것은 자연스러운 판단이라고 생각된다.
| prediction for y values with $\overline{Y}$ | ||
|---|---|---|
| bankaccount | error | error2 |
| 6 | -2 | 4 |
| 5 | -3 | 9 |
| 7 | -1 | 1 |
| 7 | -1 | 1 |
| 8 | 0 | 0 |
| 10 | 2 | 4 |
| 8 | 0 | 0 |
| 11 | 3 | 9 |
| 9 | 1 | 1 |
| 9 | 1 | 1 |
| $\overline{Y}=8$ | $SS_{total} = 30$ | |
위에서 제곱한 값의 합은? 30이다. 이는 사실, SS (Sum of Square)값이 30이라는 이야기이다. 그리고, 위에서 설명한 것처럼, 이 값은 $ SS_{total} $ 이라고 할 수 있으며 전체에러 변량이라고 할 수 있겠다.
SSres , Residual error
Residuals:
    Min      1Q  Median      3Q     Max
-1.5189 -0.8969 -0.1297  1.0058  1.5800

Coefficients:
            Estimate Std. Error t value Pr(>|t|)
(Intercept) 3.617781   1.241518   2.914  0.01947  *
income      0.015269   0.004127   3.700  0.00605  **
---
Sig. codes:  0 '***' 0.001 '**' 0.01 '*' 0.05 '.' 0.1 ' ' 1

Residual standard error: 1.176 on 8 degrees of freedom
Multiple R-squared: 0.6311,	Adjusted R-squared: 0.585
F-statistic: 13.69 on 1 and 8 DF,  p-value: 0.006046
위의 계산에서:
$$\hat{Y} = a + b X $$
$$\hat{Y} = 3.617781 + 0.015269 X $$
라고 정리할 수 있는데. . . .
아래는 이 공식을 이용하여 구한 Y의 예측값을 구한 후 (pred1), 이 값과 실제값(account)의 차이값을 구한 후 (error1), 이를 다시 제곱한 값을 (error2 ) 정리한 표이다.
| prediction for y values with regression | |||
|---|---|---|---|
| bankaccount | pred1 | error1 | error2 |
| 6 | 6.977 | 0.977 | 0.954 |
| 5 | 6.519 | 1.519 | 2.307 |
| 7 | 7.588 | 0.588 | 0.345 |
| 7 | 6.672 | -0.328 | 0.108 |
| 8 | 8.657 | 0.657 | 0.431 |
| 10 | 11.100 | 1.100 | 1.209 |
| 8 | 6.824 | -1.176 | 1.382 |
| 11 | 9.420 | -1.580 | 2.496 |
| 9 | 8.504 | -0.496 | 0.246 |
| 9 | 7.740 | -1.260 | 1.587 |
| 8 | $SS_{res} = 11.066$ | ||
여기서 구한 SS 값은? 이는 regression 곡선을 이용하여 Y값을 예측하였음에도 불구하고, 극복하지 못한 오차 (제곱의 합) 이다. 즉, 이는 SSres 에 해당하는 값이다. 그리고 이를 이용하여 SSreg 값을 구해보면 아래와 같다.
\begin{eqnarray} SS_{reg} & = & SS_{total} - SS_{res} \nonumber \\ & = & 30 - 11.066 \nonumber \\ & = & 18.934 \nonumber \end{eqnarray}
여기서 다시 한번 SStotal, SSreg, SSres 의 관계에 대해서 언급해 보면,
위의 분석에서, 추정치에 대한 표준오차:
$ s_{res} = \displaystyle \sqrt{\frac{SS_{res}}{n-2}} = \sqrt{\frac{11.06637}{8}} = 1.176136 $
이는 아래와 같은 공식으로도 구할 수 있다.
$ \displaystyle s_{res} = S_{Y} \sqrt{(1-r^2)(\frac{N-1}{N-2})} = 1.176136 $
여기서 (N-1)/(N-2)값을 1이라고 보면,
$ \displaystyle s_{res} = S_{Y} \sqrt{(1-r^2)}$
위에서, SS에 해당되는 것만 살펴보면 (양쪽의 표준편차의 분모를 제외하고 제곱을 하여 보면),
\begin{eqnarray*} \displaystyle SS_{res} & = & SS_{total} (1-r^2) \\ \displaystyle r^2 & = & \frac{SS_{total} - SS_{res}}{SS_{total}} \\ \displaystyle r^2 & = & \frac{SS_{reg}}{SS_{total}} \\ \end{eqnarray*}
과 같이 표현할 수 있다. 위의 공식을 말로 바꿔 설명해 보면,
- r2 의 값은, 즉, y의 변량을 x와 함께 설명할 수 있는 양은 전체오차에서 regression에서도 피할 수 없는 오차 ( SSres )를 뺀 것을 전체오차 (SStotal )로 나누어 준 것이다. 이 때 SStotal - SSres 은 SSreg 라고 표현할 수 있으므로, 이를 다시 설명하면, r2 은 SSreg 과 SStotal 의 비율이다라고 할 수 있다. 따라서, 아래의 ANOVA표에서 r2 값을 구해보면, 이는 white / yellow 값이 될 것이다 ( 18.934 / 30 = 0.631133333 ).
| ANOVA(b) | ||||||
|---|---|---|---|---|---|---|
| Model | Sum of Squares | df | Mean Square | F | Sig. | |
| 1.000 | Regression | 18.934 | 1.000 | 18.934 | 13.687 | 0.006 |
| Residual | 11.066 | 8.000 | 1.383 | |||
| Total | 30.000 | 9.000 | ||||
| a Predictors: (Constant), bankIncome income b Dependent Variable: bankbook number of bank |
||||||
SStotal SSreg SSres 를 이용한 F-test
회귀공식 (regression equation) 혹은 모델 (regression model)이 만들어지게 되면 이 모델에 대한 판단이 필요하다. 첫 째, regression equation에서 도출되는 잔여오차 (SSres )가 충분히 작은지 (혹은 거꾸로, regression equation에 의해서 설명된 오차 (SSreg )가 전체오차를 (SStotal ) 줄이는데 충분했는지이다. 이는 r2 에 대한 판단을 통해서 하게 되는데, 이 때 사용되는 것이 F-test이다. 또한, 변인이 갖는 계수 (coefficient) 값 ( $\hat{Y} = a + bX $ 에서 b 값)이 r2 값에 얼마나 기여했는가를 판단하는 것이 있다. 이 경우에는 b값에 대한 (즉, 기울기에 대한) t-test를 이용하게 된다. 단순회귀분석(simaple regression analysis)에서 F-test와 t-test는 중복된 테스트라고 할 수 있다. X의 설명력에 책임을 지는 것이 오직 b 뿐이기 때문이다. 그러나 $\hat{Y} = a + b_{1} X_{1} + b_{2} X_{2}$와 같은 독립변인이 여러개인 경우에는 각각의 독립변인의 기여도에 대한 테스트가 필요한데, 이를 t-test를 통해서 수행하게 된다. 즉, R2에 대한 F-test는 전체 독립변인들의 기여도에 대한 종합적 테스트라고 할 수 있고, 각 독립변인에 대한 기여도는 그 기울기에 대한 테스트로 알아본다.
위 섹션에서,
white = explained error (E) = $SS{reg}$
orange = unexplained error (U) = $SS{res}$
yellow = total error $SS_{total}$ = E + U = $SS_{reg} + SS_{res}$
degrees of freedom
for residual (number of variable -1) = 1 (blue)
for regression (number of case - number of variable) = 8 (green)
Then,
what is MS = variance = $\frac{SS}{df}$ ?
- for regression (explained portion) and ?
- for residual (unexplained portion) ?
Then, what is
- $MS_{explained} / MS_{unexplained} = MS_{regression} / MS_{residual} $ ?
- F-value for evaluating r2 portion turns out to be significant.
- F = xxx, which means . . . . X를 이용하여 Y의 변화를 이야기할 수 있는 부분인 R2 값이 통계학적으로 유의미한가를 판단할 수 있도록 도와주었다는 것 (goodness of fit).
From the above table, check out that the value of R2 = $\frac{SS_{reg}}{SS_{total}}$ and compare the value to that in the below table.
| Model Summary | ||||
|---|---|---|---|---|
| Model | R | R Square | Adjusted R Square | Std. Error of the Estimate |
| 1.000 | 0.794 | 0.631 | 0.585 | 1.176 |
| a Predictors: (Constant), bankIncome income | ||||
= 63.1% 즉, Y의 변량 중에서 X를 이용하여 설명할 수 있는 부분이 약 63%이고 이 분석을 적용할때, 잘 못될 확률, p = 0.006 .
그렇다면, 여기서
Y = a + bX 에서 b 가 R2 에 얼마나 기여했는가?
→ r2 만큼 했다고 말하는 것이 상식적이다. 왜냐하면, r2 에 기여한 변인으로 오직 하나 있는 것이 X변인이기 때문이다.2)
이 때 b가 기여했다는 판단은 t-test를 이용해서 하게된다. 이에 대한 설명은 아래 eg_3_simple_regression의 마지막 부분에 기록해 두었다.
| Coefficients(a) | ||||||
|---|---|---|---|---|---|---|
| Model | Unstandardized b Coefficients | Standardized b Coefficients | t | Sig. | ||
| B | Std. Error | Beta | ||||
| 1.000 | (Constant) | 3.618 | 1.242 | 2.914 | 0.019 | |
| bankIncome income | 0.015 | 0.004 | 0.794 | 3.700 | 0.006 | |
| a Dependent Variable: bankbook number of bank | ||||||
위에서 tb = 3.700, p = .006
이 때, (tb)2 = F value.
E.g., 2. Simple regression
data:
acidity.sav
acidity.sps
stream         spec83 ph83
Moss         	6	6.30
Orcutt       	9	6.30
Ellinwood    	6	6.30
Jacks        	3	6.20
Riceville    	5	6.20
Lyons        	3	6.10
Osgood       	5	5.80
Whetstone    	4	5.70
Upper Keyup  	1	5.70
West         	7	5.70
Boyce        	4	5.60
Mormon Hollow	4	5.50
Lawrence     	5	5.40
Wilder       	0	4.70
Templeton    	0	4.50
display labels .

output:
	Variable Labels
Variable	Position	Label
stream		1		trubutary of Miller River MA
spec83		2		Number of Fish Species
ph83		3		Average Summer pH
Variables in the working file
Get used with the variable names and labels. Then, grasp a picture what is in the data by examining a few cases.
list /cases from 1 to 5 .

output:
stream        spec83 ph83

Moss             6   6.30
Orcutt           9   6.30
Ellinwood        6   6.30
Jacks            3   6.20
Riceville        5   6.20


Number of cases read:  5    Number of cases listed:  5
list /variables stream spec83 ph83 .

output:

stream        spec83 ph83

Moss             6   6.30
Orcutt           9   6.30
Ellinwood        6   6.30
Jacks            3   6.20
Riceville        5   6.20
Lyons            3   6.10
Osgood           5   5.80
Whetstone        4   5.70
Upper Keyup      1   5.70
West             7   5.70
Boyce            4   5.60
Mormon Hollow    4   5.50
Lawrence         5   5.40
Wilder           0   4.70
Templeton        0   4.50


Number of cases read:  15    Number of cases listed:  15
Take a look at descriptive statistics. They are needed all time for your paper. Note that Warning sign appear since the variable is nominal, which means no descriptive statistics are available.
descriptive /var = all .

output:
Warnings
No statistics are computed for the following variables because they are strings: trubutary of Miller River MA.

			Descriptive Statistics
			N	Minimum	Maximum	Mean	Std. Deviation
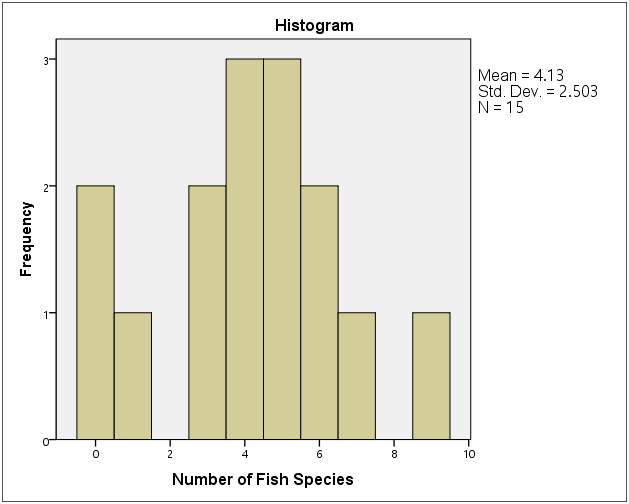
Number of Fish Species	15	0	9	4.13	2.503
Average Summer pH	15	4.50	6.30	5.7333	.55506
Valid N (listwise)	15
Explore commands gives more detail information about variables.
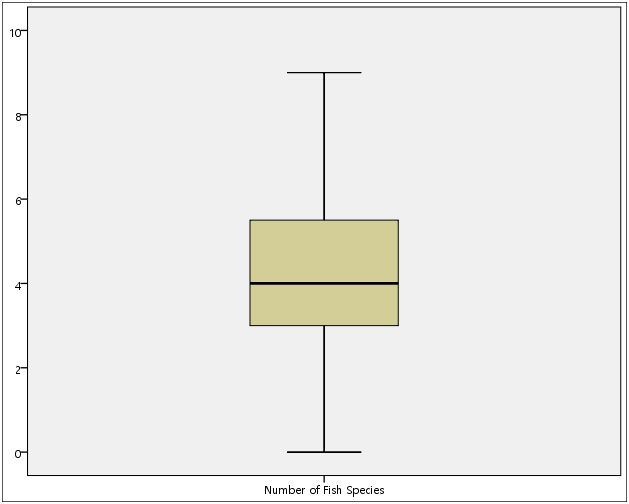
Use plots such as histogram, stemleaf, boxplot. Histogram, boxplot are omitted in the below output.
examine /variables spec83
  /plot histogram STEMLEAF boxplot.

output:

			Case Processing Summary
			Cases
				Valid		Missing		Total
			N	Percent	N	Percent	N	Percent
Number of Fish Species	15	100.0%	0	.0%	15	100.0%

		Descriptives
					Statistic	Std. Error
Number of Fish Species	  Mean		4.13		.646
	95% Confidence 	  Lower Bound	2.75
	Interval for Mean Upper Bound	5.52
	5% Trimmed Mean			4.09
	Median				4.00
	Variance			6.267
	Std. Deviation			2.503
	Minimum				0
	Maximum				9
	Range				9
	Interquartile Range		3
	Skewness			-.111		.580
	Kurtosis			-.025		1.121

Number of Fish Species Stem-and-Leaf Plot

 Frequency    Stem &  Leaf

     3.00        0 .  001
     2.00        0 .  33
     6.00        0 .  444555
     3.00        0 .  667
     1.00        0 .  9

 Stem width:   *
 Each leaf:       1 case(s)
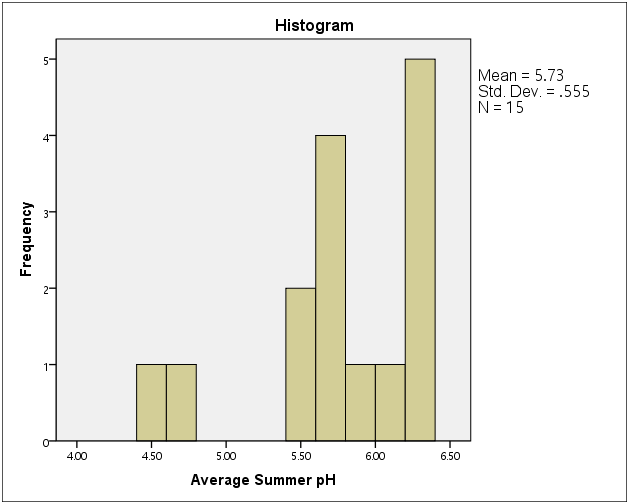
We can also use frequencies command with histogram option in order to get a histogram for ph83.
FREQUENCIES variables = ph83
  /format=NOTABLE
  /histogram .

output:

	Statistics
Average Summer pH
N	Valid	15
	Missing	0

+ histogram (omitted)
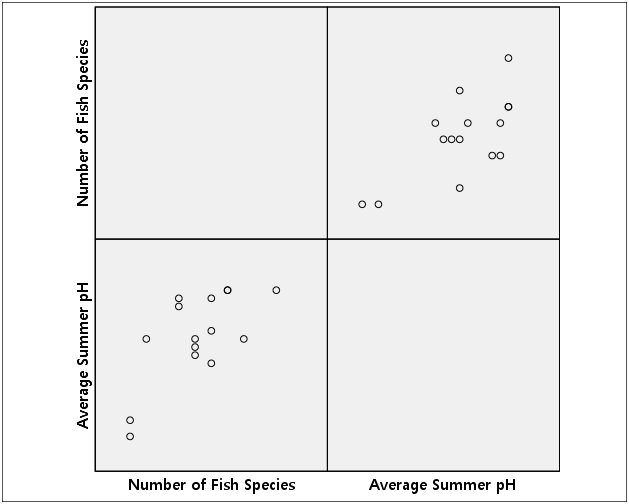
We can also examine the variables with scatterplot with two related variables (IV and DV).
GRAPH  /SCATTERPLOT (matrix) = spec83 ph83.

output:
  omitted.
데이터 셋트에 대한 탐색결과 이상이 없다고 판단이 되면, 회귀분석 테스트를 실시하도록 한다. 회귀분석을 하면 아래의 세가지 아웃풋을 디폴트로 얻게 된다.
- Variables that are used (Variables Entered/Removed + dependent variable)
- Model Summary
- ANOVA
- Coefficients
위의 결과를 얻기 전에 무엇이 IV고 무엇이 DV인가? 이 테스트의 이론적인 논의점은 무엇인가?
- We assume the quality of water (ph level) would affects (influences) the species of fishes. Hence,
- IV:
- DV:
REGRESSION
  /dependent=spec83
  /method=enter ph83.

output:

	Variables Entered/Removed(b)
Model	Variables Entered	Variables Removed	Method
1	Average Summer pHa	.	Enter
a. All requested variables entered.
b. Dependent Variable: Number of Fish Species

		Model Summary
Model	R	R Square	Adjusted R Square	Std. Error of the Estimate
1	.696a	.484		.444			1.866
a. Predictors: (Constant), Average Summer pH

			ANOVA(b)
Model			Sum of Squares		df	Mean Square	F	Sig.
1	Regression	42.462			1	42.462		12.193	.004a
	Residual	45.272			13	3.482
	Total		87.733			14
a. Predictors: (Constant), Average Summer pH
b. Dependent Variable: Number of Fish Species

			Coefficients(a)
				Unstandardized		Standardized
				Coefficients		Coefficients
Model				B	Std. Error	Beta	t	Sig.
1	(Constant)		-13.855	5.174			-2.678	.019
	Average Summer pH	3.138	.899		.696	3.492	.004
a. Dependent Variable: Number of Fish Species
From the above:
What is ANOVA for? : model evaluation
What is b for?: The contribution of x's b. In this case (simple regression), since there is only one IV, the only b gets all the credit for the R2.
What is R and R2 for? R is r (correlation). R is the ratio between SP and SSx SSy . If you put this in English (spoken language), it is the amount of Y's variance that are accounted for with X variance. Or we might say it is the ratio between covariance and product of each variance ($\frac{SP}{\sqrt{SS_X SS_Y}}$) . R2 is the actual amount of covariance that is accounted for with the variance of X.
– maybe picture needed –
This is the portion of y's variance that can be explained with the variance of X. In this regression case, it is .484, which we may say, “about 48% of y's variance is accounted for by the variance of X.”
And this co-varying is statistically significant, since F (1, 13) = 12.193, p < .01. Also, we can describe the situation with a math formula (an equation).
$\hat{Y} = -13.855 + 3.138 X $
As we can read, as ph-level goes up, the number of specifies of fishes increase. But, ph-level should be positive enough (about 5-6) in order to fish survives (at least one species could be found).
A common sense argues that there is a limit.
SSreg = 42.462
SSres = 45.272
SStotal = 87.733
r2 = SSreg / SStotal = 42.462 / 87.733 = .484.
E.g., 3. Simple regression: Adjusted R squared & Slope test
This is another example of regression. Here the concept of adjusted r square is explained.
| DATA | |
| x | y |
| 1 | 1 |
| 2 | 1 |
| 3 | 2 |
| 4 | 2 |
| 5 | 4 |
| Model Summary(b) | ||||
| Model | R | R Square | Adjusted R Square | Std. Error of the Estimate |
| 1 | 0.904 | 0.817 | 0.756 | 0.606 |
| ANOVA | ||||||
|---|---|---|---|---|---|---|
| Model | Sum of Squares | df | Mean Square | F | Sig. | |
| 1 | Regression | 4.9 | 1 | 4.9 | 13.36363636 | 0.035352847 |
| Residual | 1.1 | 3 | 0.366666667 | |||
| Total | 6 | 4 | ||||
| a Predictors: (Constant), x | ||||||
| b Dependent Variable: y | ||||||
r-square:
- $\displaystyle r^2=\frac{SS_{total}-SS_{res}}{SS_{total}} = \frac{\text{Explained sample variability}}{\text{Total sample variability}}$
- $\displaystyle r^2=\frac{SS_{total}-SS_{res}}{SS_{total}} = 1-\frac{SS_{res}}{SS_{total}} = 0.816666667 = R^2 $
- Hence, R square value = $ 4.9 / 6 = 1 - (1.1 / 6) = .817 $ grey cell in the r square summary
- Usually interpret with % ( by multiplying 100 to $r^2$ )
Adjusted r-square:
- $\displaystyle r^2=\frac{SS_{total}-SS_{res}}{SS_{total}} = 1 - \frac{SS_{res}}{SS_{total}} $ ,
- This is equivalent to: $\displaystyle 1 - \frac {Var_{res}}{Var_{total}} $
- Var = MS = s2 = SS / n
- Here, we replace the value n
- for Varres = SSres / n - p - 1; p: number of variables
- Varres = $\displaystyle \frac {SS_{\text{res}}} {n - p - 1} = \frac{1.100}{3} = .367$
- n - p - 1 = n - # of independent variables - 1
- Vartotal = $\displaystyle \frac {SS_{\text{tot}}} {n - 1} = \frac {6}{4} = 1.5 $
- This is the same logic as we used n-1 instead of n in order to get estimation of population standard deviation with a sample statistics.
- Also, it penalizes the meaningless addition of independent variables in multiple regression.
- if p goes up, the latter part goes up, which means
- R2 value goes down – which means
- more (many) IVs is not always good
- Therefore, the Adjusted r2 = .367 / 1.5 = 0.756 (green color cell)
If we take a look at the ANOVA result:
| ANOVA | ||||||
|---|---|---|---|---|---|---|
| Model | Sum of Squares | df | Mean Square | F | Sig. | |
| 1 | Regression | 4.9 | 1 | 4.9 | 13.36363636 | 0.035352847 |
| Residual | 1.1 | 3 | 0.366666667 | |||
| Total | 6 | 4 | ||||
| a Predictors: (Constant), x | ||||||
| b Dependent Variable: y | ||||||
- ANOVA, F-test, $F=\frac{MS_{between}}{MS_{within}}$
- MS_between?
- MS_within?
- MS for residual
- $s = \sqrt{s^2} = \sqrt{\frac{SS_{res}}{n-2}} $
- random difference (MSwithin ): $s^2 = \frac{SS_{res}}{n-2} $
- MS for regression . . . Obtained difference
- do the same procedure at the above in MS for residual.
- but, this time degress of freedom is k-1 (number of variables -1 ), 1.
- Then what does F value mean?
Then, we take another look at coefficients result:
| example | ||||||||
|---|---|---|---|---|---|---|---|---|
| Model | Unstandardized Coefficients | Standardized Coefficients | t | Sig. | 95% Confidence Interval for B | |||
| B | Std. Error | Beta | Lower Bound | Upper Bound | ||||
| 1 | (Constant) | -0.1 | 0.635085296 | -0.157459164 | 0.88488398 | -2.121124854 | 1.921124854 | |
| x | 0.7 | 0.191485422 | 0.903696114 | 3.655630775 | 0.035352847 | 0.090607928 | 1.309392072 | |
| a Dependent Variable: y | ||||||||
- Why do we do t-test for the slope of X variable? The below is a mathematical explanation for this.
- Sampling distribution of b:
- $\displaystyle \sigma_{b_{1}} = \frac{\sigma}{\sqrt{SS_{x}}}$
- estimation of $\sigma_{b_{1}}$ : substitute sigma with s
- t-test
- $\displaystyle t=\frac{b_{1} - \text{Hypothesized value of }\beta_{1}}{s_{b_{1}}}$
- Hypothesized value of beta 값은 대개 0. 따라서 t 값은
- $\displaystyle t=\frac{b_{1}}{s_{b_{1}}}$
- $\displaystyle s_{b_{1}} = \frac {MSE}{SS_{X}} = \frac{\sqrt{\frac{SSE}{n-2}}}{\sqrt{SS_{X}}} = \display\frac{\sqrt{\frac{\Sigma{(Y-\hat{Y})^2}}{n-2}}}{\sqrt{\Sigma{(X_{i}-\bar{X})^2}}} $
| X | Y | $X-\bar{X}$ | ssx | sp | ypredicted | error | error2 |
|---|---|---|---|---|---|---|---|
| 1 | 1 | -2 | 4 | 2 | 0.6 | -0.4 | 0.16 |
| 2 | 1 | -1 | 1 | 1 | 1.3 | 0.3 | 0.09 |
| 3 | 2 | 0 | 0 | 0 | 2 | 0 | 0 |
| 4 | 2 | 1 | 1 | 0 | 2.7 | 0.7 | 0.49 |
| 5 | 4 | 2 | 4 | 4 | 3.4 | -0.6 | 0.36 |
| $\bar{X}$ = 3 | 2 | SSX = 10 | $\Sigma$ = 7 | SSE = 1.1 |
Regression formula: ypredicted = -0.1 + 0.7 X
SSE = Sum of Square Error
기울기 beta(b)에 대한 표준오차값은 아래와 같이 구한다.
$$se_{\beta} = \frac {\sqrt{SSE/n-2}}{\sqrt{SSX}} \\
& = & \frac {\sqrt{1.1/3}}{\sqrt{10}} = 0.191485 $$
그리고 b = 0.7
따라서 t = b / se = 3.655631
x <- c(1, 2, 3, 4, 5)
y <- c(1, 1, 2, 2, 4)
mody <- lm(y ~ x)
E.g., 4. Simple regression
Another example of simple regression: from elemapi.sav
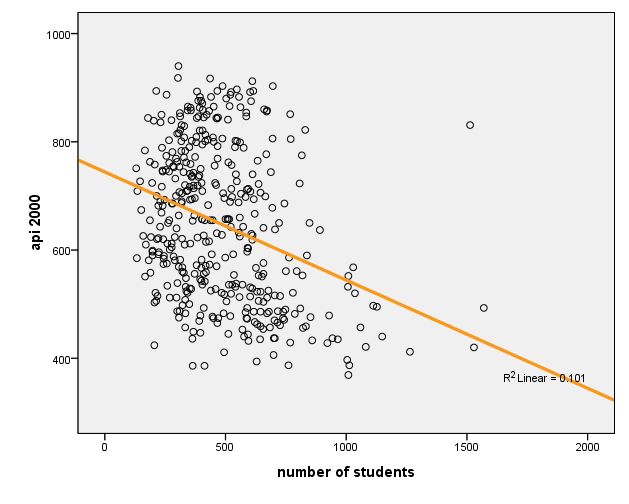
This is the same data set in Data Examination section. We are interested in the relationship between api00 and enroll
display labels .
| Data Label description | ||
|---|---|---|
| Variable Labels | ||
| Variable | Position | Label |
| snum | 1 | school number |
| dnum | 2 | district number |
| api00 | 3 | api 2000 |
| api99 | 4 | api 1999 |
| growth | 5 | growth 1999 to 2000 |
| meals | 6 | pct free meals |
| ell | 7 | english language learners |
| yr_rnd | 8 | year round school |
| mobility | 9 | pct 1st year in school |
| acs_k3 | 10 | avg class size k-3 |
| acs_46 | 11 | avg class size 4-6 |
| not_hsg | 12 | parent not hsg |
| hsg | 13 | parent hsg |
| some_col | 14 | parent some college |
| col_grad | 15 | parent college grad |
| grad_sch | 16 | parent grad school |
| avg_ed | 17 | avg parent ed |
| full | 18 | pct full credential |
| emer | 19 | pct emer credential |
| enroll | 20 | number of students |
| mealcat | 21 | Percentage free meals in 3 categories |
enroll: enrollment of students in a school district
api00: academic performance index in 2000
Q: what is the hypothesis here?
regression
  /dependent api00
  /method=enter enroll.
| Model Summaryb | ||||
|---|---|---|---|---|
| Model | R | R Square | Adjusted R Square | Std. Error of the Estimate |
| 1 | .318a | .101 | .099 | 135.026 |
| a. Predictors: (Constant), number of students | ||||
| b. Dependent Variable: api 2000 | ||||
| ANOVAb | ||||||
|---|---|---|---|---|---|---|
| Model | Sum of Squares | df | Mean Square | F | Sig. | |
| 1 | Regression | 817326.293 | 1 | 817326.293 | 44.829 | .000a |
| Residual | 7256345.704 | 398 | 18232.024 | |||
| Total | 8073671.998 | 399 | ||||
| a. Predictors: (Constant), number of students | ||||||
| b. Dependent Variable: api 2000 | ||||||
| Coefficientsa | ||||||
|---|---|---|---|---|---|---|
| Model | Unstandardized Coefficients | Standardized Coefficients | t | Sig. | ||
| B | Std. Error | Beta | ||||
| 1 | (Constant) | 744.251 | 15.933 | 46.711 | .000 | |
| number of students | -.200 | .030 | -.318 | -6.695 | .000 | |
| a. Dependent Variable: api 2000 | ||||||
$$Y = 744.251 - .200 X $$
| Residuals Statisticsa | ||||||
|---|---|---|---|---|---|---|
| Minimum | Maximum | Mean | Std. Deviation | N | ||
| Predicted Value | 430.46 | 718.27 | 647.62 | 45.260 | 400 | |
| Std. Predicted Value | -4.798 | 1.561 | .000 | 1.000 | 400 | |
| Standard Error of Predicted Value | 6.751 | 33.130 | 8.995 | 3.205 | 400 | |
| Adjusted Predicted Value | 419.51 | 718.81 | 647.64 | 45.452 | 400 | |
| Residual | -285.500 | 389.148 | .000 | 134.857 | 400 | |
| Std. Residual | -2.114 | 2.882 | .000 | .999 | 400 | |
| Stud. Residual | -2.118 | 2.964 | .000 | 1.001 | 400 | |
| Deleted Residual | -286.415 | 411.494 | -.014 | 135.570 | 400 | |
| Stud. Deleted Residual | -2.127 | 2.993 | .000 | 1.003 | 400 | |
| Mahal. Distance | .000 | 23.022 | .997 | 2.245 | 400 | |
| Cook's Distance | .000 | .252 | .003 | .013 | 400 | |
| Centered Leverage Value | .000 | .058 | .003 | .006 | 400 | |
| a. Dependent Variable: api 2000 | ||||||
graph
  /scatterplot(bivar)=enroll with api00
  /missing=listwise .
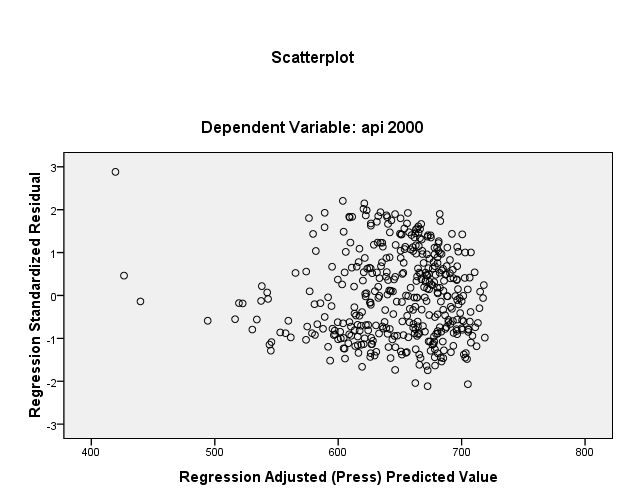
We want to scatterplot for prediction values and standardized residual values.
regression
  /dependent api00
  /method=enter enroll
  /scatterplot=(*zresid ,*adjpred ) .
For the reference, the below is the terms used in SPSS.
| regression plot | |
|---|---|
| Keyword | Statistic |
| dependnt | dependent variable |
| *zpred | standardized predicted values |
| *zresid | standardized residuals |
| *dresid | deleted residuals |
| *adjpred . | adjusted predicted values |
| *sresid | studentized residuals |
| *sdresid | studentized deleted residuals |
regression, for what?
- The prediction power or effects of IVs explained by regression
H1. 과학자들의 성취도는 졸업학교의명성, 직장만족도, 논문숫자, 논문 질에 의해서 설명(예측)될 수 있다.
H1. 방사선연구에 대한 태도는 일반과학에 대한 태도와 원자력연구에 대한 태도에 의해서 설명될 수 있다.
H1. IPTV 프로그램에 대한 호감도는 remote controller 조작의 익숙성, 연령, 가족구성숫자, 경제력에 의해서 예측된다.
H1. 무엇이 보통사람들이 과학관을 찾도록 하는가?
- Each IV's effect could be discerned.
H1. 과학자들의 성취도를 설명하는 졸업학교의명성, 직장만족도, 근무연수, 논문숫자, 그리고 논문질의 설명력에는 차이가 있을 것이다.
H1. 방사선연구에 대한 태도는 일반과학보다는 원자력연구에 대한 태도의 영향을 더 받을 것이다.
- Sometimes, you [wiki:SequentialRegressionAnalysis ''control'
some IVs in order to see the pure effect of other IVs
- Model improvement with new IVs
- See interaction effects (will be explained later)
Assumptions
See Pre-assumptions of Regression Analysis
- Linearity - the relationships between the predictors and the outcome variable should be linear
- Normality - the errors should be normally distributed - technically normality is necessary only for the t-tests to be valid, estimation of the coefficients only requires that the errors be identically and independently distributed
- Homogeneity of variance (or Homoscedasticity) - the error variance should be constant
- Independence - the errors associated with one observation are not correlated with the errors of any other observation
- Model specification - the model should be properly specified (including all relevant variables, and excluding irrelevant variables)
- Influence - individual observations that exert undue influence on the coefficients
- Collinearity or Singularity - predictors that are highly collinear, i.e. linearly related, can cause problems in estimating the regression coefficients.
Exercise
| 예상학점과 클래스 평가 | ||||
|---|---|---|---|---|
| predGP | clsQuality | predGP2 | clsQuality2 | XY |
| 3.50 | 3.40 | 12.25 | 11.56 | 11.9 |
| 3.20 | 2.90 | 10.24 | 8.41 | 9.28 |
| 2.80 | 2.60 | 7.84 | 6.76 | 7.28 |
| 3.30 | 3.80 | 10.89 | 14.44 | 12.54 |
| 3.20 | 3.00 | 10.24 | 9.00 | 9.6 |
| 3.20 | 2.50 | 10.24 | 6.25 | 8 |
| 3.60 | 3.90 | 12.96 | 15.21 | 14.04 |
| 4.00 | 4.30 | 16.00 | 18.49 | 17.2 |
| 3.00 | 3.80 | 9.00 | 14.44 | 11.4 |
| 3.10 | 3.40 | 9.61 | 11.56 | 10.54 |
| 3.00 | 2.80 | 9.00 | 7.84 | 8.4 |
| 3.30 | 2.90 | 10.89 | 8.41 | 9.57 |
| 3.20 | 4.10 | 10.24 | 16.81 | 13.12 |
| 3.40 | 2.70 | 11.56 | 7.29 | 9.18 |
| 3.70 | 3.90 | 13.69 | 15.21 | 14.43 |
| 3.80 | 4.10 | 14.44 | 16.81 | 15.58 |
| 3.80 | 4.20 | 14.44 | 17.64 | 15.96 |
| 3.70 | 3.10 | 13.69 | 9.61 | 11.47 |
| 4.20 | 4.10 | 17.64 | 16.81 | 17.22 |
| 3.80 | 3.60 | 14.44 | 12.96 | 13.68 |
| 3.30 | 4.30 | 10.89 | 18.49 | 14.19 |
| 3.20 | 4.00 | 10.24 | 16.00 | 12.8 |
| 3.10 | 2.10 | 9.61 | 4.41 | 6.51 |
| 3.90 | 3.80 | 15.21 | 14.44 | 14.82 |
| 4.30 | 2.70 | 18.49 | 7.29 | 11.61 |
| 2.90 | 4.40 | 8.41 | 19.36 | 12.76 |
| 3.20 | 3.10 | 10.24 | 9.61 | 9.92 |
| 3.50 | 3.60 | 12.25 | 12.96 | 12.6 |
| 3.30 | 3.90 | 10.89 | 15.21 | 12.87 |
| 3.20 | 2.90 | 10.24 | 8.41 | 9.28 |
| 4.10 | 3.70 | 16.81 | 13.69 | 15.17 |
| 3.50 | 2.80 | 12.25 | 7.84 | 9.8 |
| 3.60 | 3.30 | 12.96 | 10.89 | 11.88 |
| 3.70 | 3.70 | 13.69 | 13.69 | 13.69 |
| 3.30 | 4.20 | 10.89 | 17.64 | 13.86 |
| 3.60 | 2.90 | 12.96 | 8.41 | 10.44 |
| 3.50 | 3.90 | 12.25 | 15.21 | 13.65 |
| 3.40 | 3.50 | 11.56 | 12.25 | 11.9 |
| 3.00 | 3.80 | 9.00 | 14.44 | 11.4 |
| 3.40 | 4.00 | 11.56 | 16.00 | 13.6 |
| 3.70 | 3.10 | 13.69 | 9.61 | 11.47 |
| 3.80 | 4.20 | 14.44 | 17.64 | 15.96 |
| 3.70 | 3.00 | 13.69 | 9.00 | 11.1 |
| 3.70 | 4.80 | 13.69 | 23.04 | 17.76 |
| 3.30 | 3.00 | 10.89 | 9.00 | 9.9 |
| 4.00 | 4.40 | 16.00 | 19.36 | 17.6 |
| 3.60 | 4.40 | 12.96 | 19.36 | 15.84 |
| 3.30 | 3.40 | 10.89 | 11.56 | 11.22 |
| 4.10 | 4.00 | 16.81 | 16.00 | 16.4 |
| 3.30 | 3.50 | 10.89 | 12.25 | 11.55 |
| sum(X) = 174.30 | sum(Y) = 177.50 | |||
| Sx = 0.351 | Sy = 0.614 | |||
| SSx = 613.650 | SSy = 648.570 | SP = 621.94 | ||

